5 Building Dynamic Models
Population Model
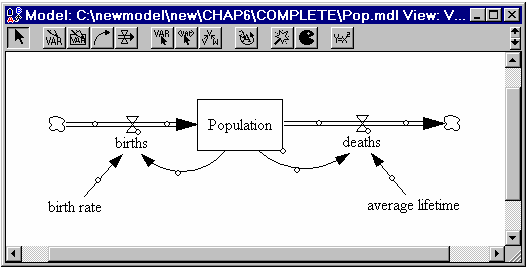
This example shows you how to develop and use a simple model of population growth. No prerequisite knowledge is assumed. Mouse clicks are usually done with the left button and are usually single clicks, unless otherwise noted in the text. You will be building the model shown below:
| Ø | Select the Vensim Development Environment from the main menu. |
| Ø | Click on the New Model button on the Main Toolbar, or select the menu File>New Model. |
| Ø | Click OK to the Time Bounds dialog box. |
| Ø | Click on the Box Variable sketch tool. The cursor will change to a bar with a box. Position the cursor in the upper middle of the window and click. An editing box will appear, type the word Population into the editing box then press Enter (on keyboard). |
| Ø | Click on the Rate sketch tool. The cursor shape will change to a rate arrow. Click once (press and release the mouse button) 2 inches (5 cm) left of the box containing the word Population, then move the mouse over onto the box Population and click once on it. An editing box will appear, type the word births and press Enter. |
| Ø | With the Rate tool still selected, click once on the box Population, then move the mouse 2 inches (5 cm) to the right and click again. An editing box will appear, type the word deaths and press Enter. |
| Ø | Now select the Variable sketch tool, the cursor will change to a bar. Click below births (on a blank part of the screen) and type birth rate and press Enter. Click below deaths and type average lifetime and press Enter. |
| Ø | Now select the Arrow sketch tool. Click on birth rate, move the cursor onto births and click again. Click on average lifetime, move the cursor onto deaths and click again. |
| Ø | Click on the box containing Population, move the cursor to an empty point on the diagram a little below Population and births and click once, then move the cursor onto births and click again. A curved arrow should join Population and births; you can move this arrow around by using the pointing tool to drag the circle (handle) appearing in its middle. |
| · | Click on the box containing Population, move the cursor to an empty point on the diagram a little below Population and deaths and click once, then click once onto deaths and click again. |
| Ø | You can change fonts and colors by using the Pointer tool, selecting a sketch object, and clicking on the Status Bar (at the bottom), or by clicking with the right mouse button on a sketch object, changing the options and clicking OK. |
You have now completely specified the structure for the model. Next you need to specify the equations precisely defining that structure.
| Ø | Click on the Equations sketch tool. The variable names will all change appearance (shaded black). |
| Ø | Click on the variable births. |
Variable Type: Auxiliary
The Equation Editor opens. The top of the editor has the name of the variable we clicked on: births. The drop-down list box on the left shows the type of variable: Auxiliary. Vensim considers Rates and Auxiliaries to be the same Type of variable. Click on the drop-down arrow to see the other types. Make sure that Auxiliary is still selected when you leave the list. The cursor is positioned in the equation editing box (next to the = sign).
| Ø | Complete the equation for births as below (in the editing box) |
EITHER
| Ø | By typing Population * birth rate |
OR
| Ø | Click on the variable Population in the Variables list (in the middle of the Equation Editor), then type the * symbol (or click on it in the Equation Editor keypad), then click on birth rate in the Variables list. |
Spaces and new lines can be added to the equation for increased clarity, but are not necessary.
Now we will add the units of measurement for births.
| Ø | Type in the units of measurement rabbit/week in the Units: box. This indicates that we measure the Rate of births in rabbits per week. Click on OK (or press Enter). |
If the model structure and equation agree and there are no syntax errors in the equation, the dialog box will disappear. If there are problems with the structure or equations, you will receive an error message indicating what is wrong.
Variable Type: Level
| Ø | Click on Population. |
| Ø | The Equation Editor opens and is slightly different from what we saw with the variable births. |
The drop-down list box on the left shows the type of variable: Level. Left of the equation editing box is the INTEG function that defines a Level (integrating the variable over time). An equation is already present in the equation editing box. Because we connected Rates with the names births and deaths to the Level, Vensim automatically enters the Rates to the Level equation. Rates constructed by clicking first outside, and then on the Level are considered positive (inwards) flows; Rates constructed by clicking on the Level, and then outside the Level are considered negative (draining) flows. If the rates are drawn in the a different direction the sign can be changed in the equation editor. The equation for this Level is correct, births add to Population, deaths subtract from Population, so we need not change them.
The Equation Editor for a Level has an extra editing box to set the starting or initial value; the cursor is placed there.
| · | In the Initial Value editing box, type in 500. |
This value is the initial number of rabbits at the start of the simulation (time zero).
| · | Type in the units of rabbit in the Units: box. Click on OK (or press Enter). |
| · | Click on birth rate. Type in the numbers 0.04 in the editing box. |
| · | Type in the units fraction/week. Click OK. |
This means that the fractional birth rate is measured in fraction (of rabbits) per week. Another way of saying this is (rabbits born / rabbit population) / week (rabbit/rabbit)/week (rabbit cancels out).
| · | Complete the remaining two equations as they are shown in the Equations listing below. |
All model variables should appear clear in the sketch after all the equations are entered. Units that have been previously entered can be selected again by clicking on the arrow in the units box and selecting from the drop-down list.
pop.mdl Equations
average lifetime = 25
Units: week
birth rate = 0.04
Units: fraction/week
births = Population * birth rate
Units: rabbit/week
deaths = Population / average lifetime
Units: rabbit/week
Population = INTEG(
births - deaths,
500)
Units: rabbit