
Causal Tracing™
Causal Tracing enables fast and accurate analysis of model dynamics
During construction of a model and while analyzing an existing model, it is useful to discover what things are causing other things to change. Looking in one direction, you can discover which variables cause a particular variable to change. Looking in the other direction, you can discover which variables are changed (or used) by a particular variable. The variable under study is called the “workbench variable.”
Tree Diagram
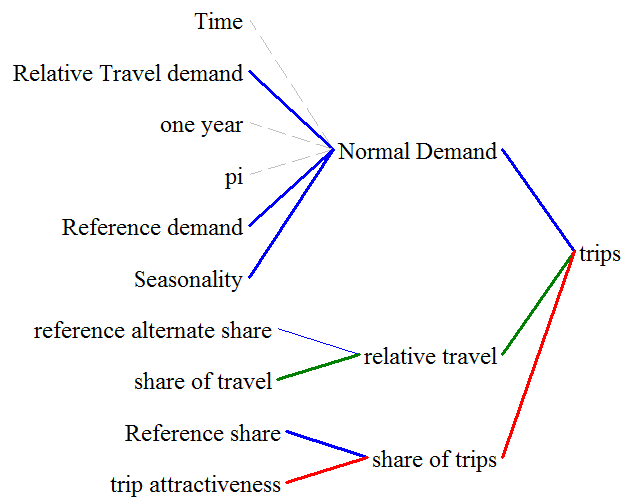
The Tree Diagram analysis tool creates output windows showing a tree of causes branching off the workbench variable. The Causes Tree Diagram shows the causes of a variable; the Uses Tree Diagram shows the uses of a variable. Tree Diagrams show causes and uses up to two variables distant (the default setting). You can continue to trace the causes (or uses) of a variable throughout a model by selecting a new workbench variable to trace (such as net hires in the diagram above) and again clicking on the Causes Tree analysis tool.
Tracing Behavior
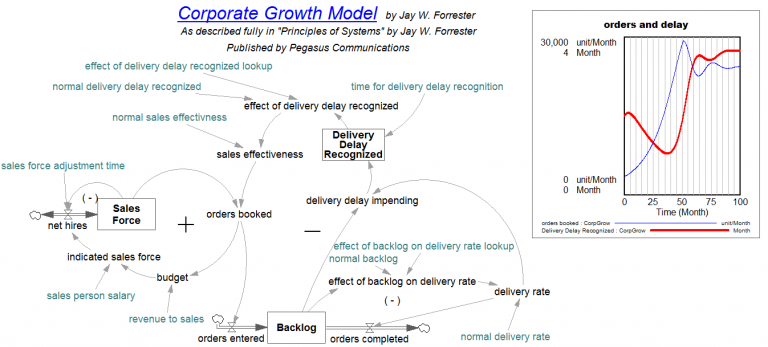
Model behavior can be difficult to analyze quickly, especially when trying to discover exactly which variables and feedback loops are contributing certain components of behavior to a particular variable. Consider the model below. The model contains a number of interacting feedback loops which produce oscillating behavior for the variable Backlog. Why is Backlog oscillating?
First, Backlog is selected as the workbench variable. Next, the Causes Strip graph analysis tool is clicked producing the first strip graph in the set below.
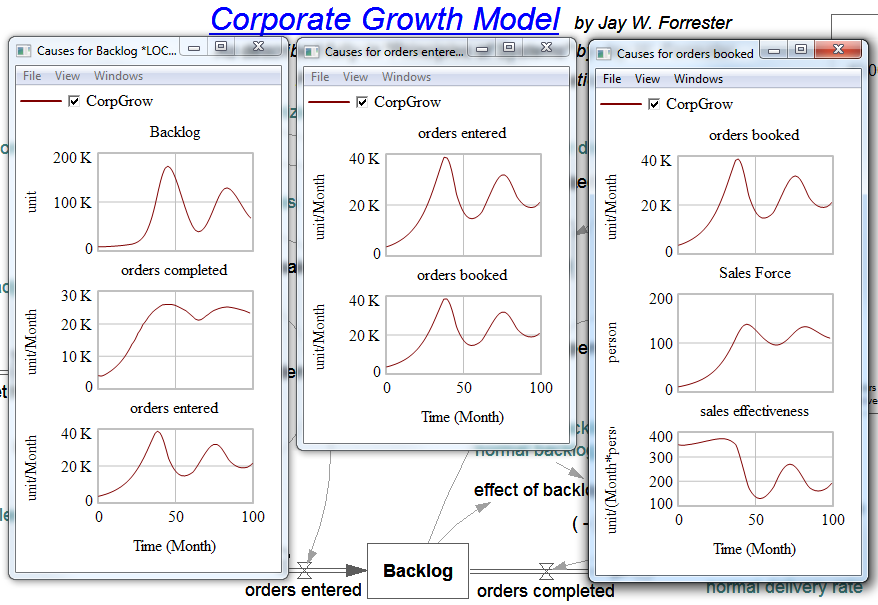
Note how the two variables that cause Backlog to change have somewhat different behaviors. Orders completed increases then gently oscillates, while orders entered grows and oscillates dramatically. Orders entered is playing the major part in causing Backlog to oscillate. Let us examine why orders entered oscillates.
Selecting orders entered as the workbench variable, we create a Causes Strip graph and discover that the only variable causing orders entered is orders booked. Selecting orders booked as the workbench variable, we create a Causes Strip graph and discover that two variables cause orders booked: Sales Force and sales effectiveness. Sales Force is oscillating gently, while sales effectiveness is oscillating strongly.
Dominant Feedback Loops
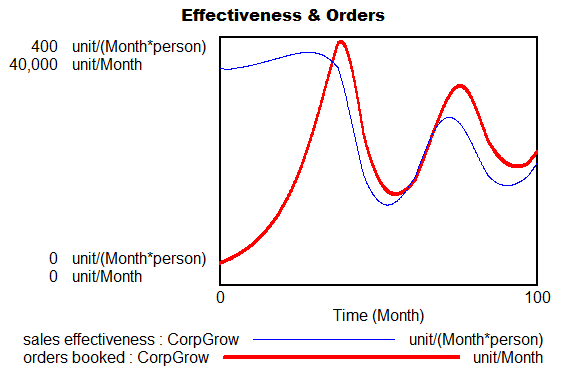
If you carefully examine the timing of the oscillations, you see that the peaks (or troughs) in sales effectiveness occurs before the peaks (or troughs) in orders booked (or Sales Force). This tells us that the oscillations in the feedback loop containing sales effectiveness are driving the oscillations in the variables in the other feedback loop. Actually, because of potentially large phase shifts, it is the first peak in sales effectiveness (and the negative feedback loop) that should be compared to the first peak in orders booked (and Sales Force) (which you can see on the set of causes strip graphs above).
Looking at the causal loop diagram above, we see that the two major feedback loops converge at the variable orders booked, and it is the negative feedback loop through sales effectiveness that creates the major oscillations which are carried over into the positive feedback loop through Sales Force.