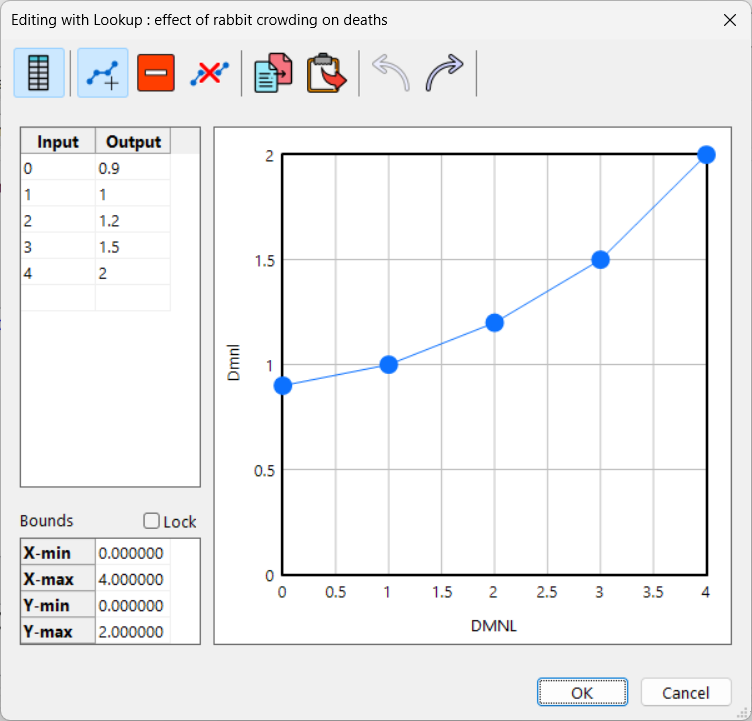
Ø You can modify values in the Input/Output list, or by dragging a point around on the graph.
| Ø | To remove a point, click on the button Clear Points and then with the Delete icon, click on the point on the graph. Your graph should look like: |

| Ø | Click on OK and the Graph Lookup Editor closes. |
Now you will see the graph equation expressed as a table of values enclosed in parentheses. These values could have been typed in directly, but instead we generated them in the Graph Lookup Editor.
| Ø | Add the units Dmnl (for Dimensionless, which you could also have typed in) to the Units editing box, then click OK to close the Equation Editor. |
The units Dimensionless are pretty important to understand. When we normalized the input to the Lookup, we divided the Rabbit Population (measured in rabbits) by carrying capacity (also measured in rabbits) leaving a dimensionless variable.
| Ø | Click on the Save button on the Toolbar to save your model. |