Now let us make a temporary change to the Lookup and simulate the model again.
| Ø | Click on the Set Up a Simulation button. |
| Ø | Click on the Runname editing box and type run2 or some other run name. |
| Ø | Click on the variable effect of rabbit crowding on deaths appearing yellow/blue in the sketch. |
The Graph Lookup Editor will appear.
| Ø | With the mouse, move some of the points on the graph to change the steepness of the curve. For example, drag the points a little higher. If you need to, increase or decrease the scale by clicking on the drop down boxes for Y-max: Y-min: X-max: X-min: or typing in new values. You can also add extra points or delete points. (You could also change the values from the keyboard in the Input and Output fields on the left.) Click the OK button. |
This is a temporary change for this run only, and does not permanently alter the values in your model.
| Ø | Click the Simulate button and the model will simulate. |
| Ø | Click on Rabbit Population to select it, then click on the Graph tool. |
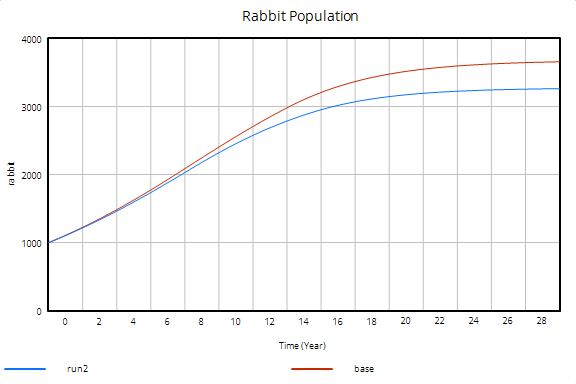
You might get a graph such as the one below, showing reduced size in final Rabbit Population, or something quite different. The graph below was a result of an increased effect of the Lookup table (increased values).

