| Ø | Click on the Graph tool or the Causes Strip graph to investigate the behavior of key variables, such as Potential Customers, Customers, and new customers (as well as any other variables that you want to see). |
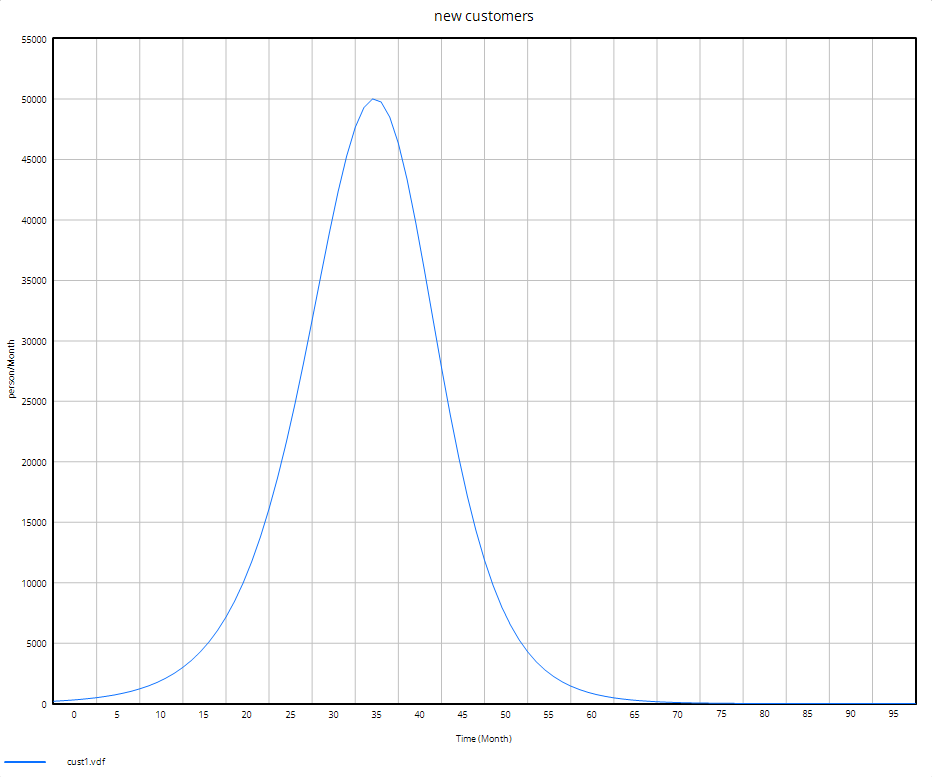
The variable new customers should give you the following graph:
