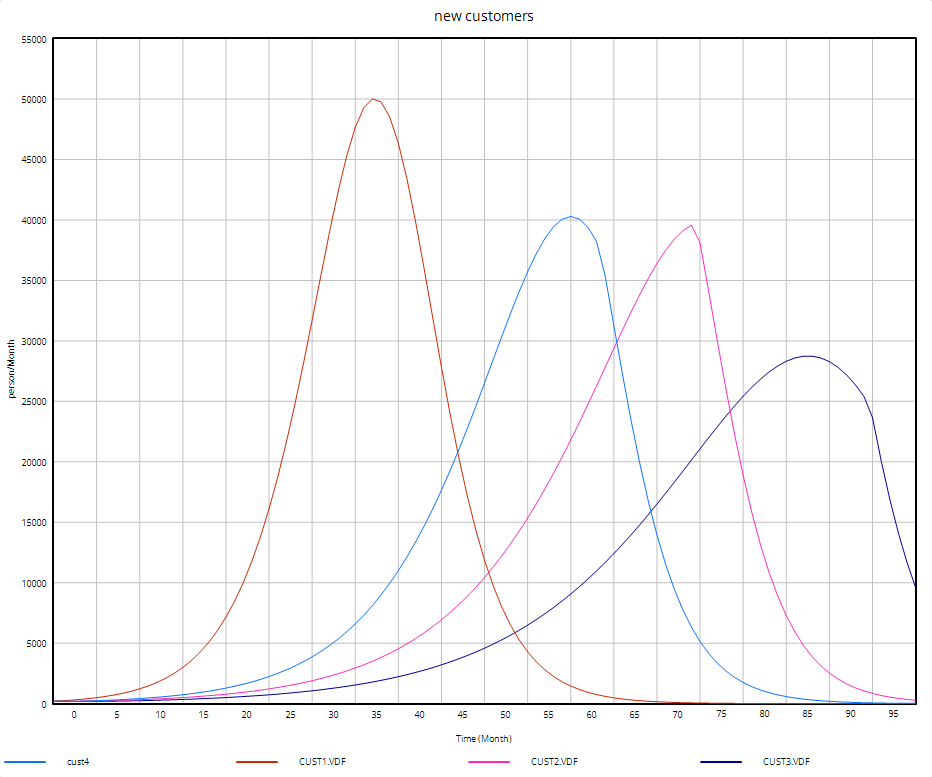
Graphs and Strip Graphs can display lines in different colors and thicknesses as well as with attached numbers and symbols. We will manipulate the options for the Graph tool; the same methods can be applied to the Strip Graph tool.
EITHER
| Ø | Open the cust3.mdl model you created in Chapter 8 |
OR
| Ø | Open the model cust3.mdl in the directory UserGuide\chap08\complete. |
| Ø | Click on the Control Panel button then on the Datasets tab. Check to see that the runs cust1 through cust4 are all loaded. If they are not loaded, double click on each run in the Available list box to load them. |
| Ø | Click on the variable new customers appearing in the sketch to select it as the Workbench Variable. |
The Vensim default for the Graph tool is for graphing thin lines with different colors (the colors do not show in the printed User’s Guide):

Patterned Graph Lines (Color)
| Ø | Select the menu Tools>Options…. Under the Graph Lines field, click the first option button for Patterned (underneath Screen). Click on OK. |
Reset the Global Options dialog to defaults by:
| Ø | Select the menu Tools>Options…. Under the Graph Lines field, click the first option button for Solid for Color. If you want, check Thick lines for Graph tool (if you prefer them). Click OK. |
| Ø | Close the graph by clicking the close button or pressing the Del key. |
Dots-Only Graphs
| Ø | Click with the right mouse button on the Graph tool. In the Line Type field, click the option button for Dots Only. Click OK. |
| Ø | Click on the Graph tool. |

Reset the Graph tool options by:
| Ø | Click with the right mouse button on the Graph tool. In the Line Type field, click the option button for Linear Interp. Click OK. |