We have a short list of things we know will need to be in our model just to make it possible to use Reality Check equations. Armed with a very basic understanding of exponential growth, we can fill in our skeleton framework to build a model. Suppose we start with the simplest possible model (yeast1.mdl in UserGuide\CHAP14):

INITIAL TIME = 0, FINAL TIME = 300, Units: Minute
average lifetime = 250
Units: Minute
division rate = 0.08
Units: 1/Minute
divisions = Yeast Count*division rate
Units: Cell/Minute
Sugar = 100
Units: g
temperature = 85
Units: Farenheit
terminations = Yeast Count/average lifetime
Units: Cell/Minute
TIME STEP = 1
Units: Minute
Water = 100
Units: ml
Yeast Count = INTEG( divisions-terminations,100)
Units: Cell
In this model we are not making use of Sugar, Water or Temperature, and they have been set to constants with the Type drop down box in the Equation Editor.
Next, we run our Reality Check equations on this model. Click on the Reality Check button on the Toolbar, or open the Simulation Control Dialog and click on the Reality Check button.

In the Reality Check Control dialog you will see a list of all the Constraints for the model. Below that is a list of Test Inputs. One, big growth, was named explicitly while the others are simply derived from the conditional parts of the different Constraints.
Clicking on Test All begins a series of simulations. The following violations are reported:

The condensed report is:
Starting testing of Constraint- cold is dormant
Test inputs :
temperature<50
Starting to test the constraint -cold is dormant
The constraint -cold is dormant- violated at time 0
--------------
The constraint -drink or die- violated at time 11
--------------
The constraint -eat or die- violated at time 11
--------------
The constraint -hot is dead- violated at time 11
--------------
The constraint -hunger from growth- violated at time 1
--------------
The constraint -thirst from growth- violated at time 1
--------------
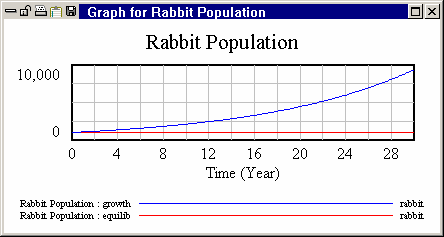
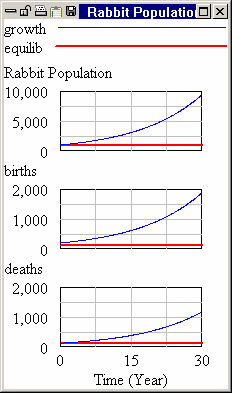
Every Constraint has been violated. This is not a great surprise since the elements involved in the Constraints were not connected in the model. The model as presented represents a basic growth mechanism. No attention has been given to either control or containment which is what all the Constraints relate to. In addition to the error window there will be 6 graphs such as:

The top line shows what divisions does, while the bottom line shows what it ought to do.
The report window ends with a summary of what has happened.
*****************
0 successes and 6 failures testing 6 Reality Check equations
The Reality Check Index as run is 0
Closeness score is 0.0% on 6 measurements
The first line is a summary count. The second line reports the Reality Check Index. This is defined as the number of successes divided by the product of the number of dynamic variables in the model with the total number of variables in the model. Since for every variable pair there is the potential for one or more Reality Check equations this index is something that should be near one for a model with a complete Reality Check set.
Finally a closeness score is reported. The closeness score is a the average closeness of a Reality Check. If a Reality Check Passes, its closeness if 1. It it fails its closeness is 1 minus the average absolute error divided by the amount of variation in the variable being checked. Thus a Reality Check that only just fails has a Closeness score close to 1, so that the closeness score is a continuous measure of how badly, on average, Constraints have been violated.