Vensim provides two default Analysis toolsets. default1.vts is what we have been working with so far. default2.vts contains more tools than default1.vts. You can also create and save your own toolset.
For Vensim PLE Plus simply click on the bar graph tool. Otherwise:
| Ø | Select the menu item Tools>Analysis Toolset>Open…. |
| Ø | Click No when asked if you want to save the current toolset. |
| Ø | Select default2.vts and click Open. |
| Ø | Click with the right mouse button on the Bar Graph tool. |
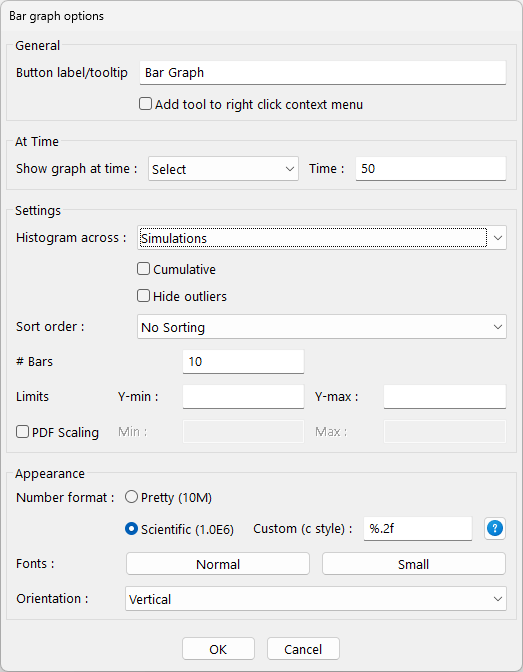
| Ø | In the As Histogram field, check the box On, check the box Sensitivity. In the At Time field, click the radio button Select, then type 50 in the Time box. Click OK. |
The dialog should look like the one shown below.

| Ø | Select the Control Panel Datasets tab and check that sensitivity is still loaded. Check that Sales Force is still the Workbench Variable. |
| Ø | Click on the Bar Graph tool. |
A sensitivity histogram will be generated showing a cross section at the mid time of the simulation, 50 months.

Sales Force in people is shown along the X axis. The Y axis represents the number of simulations. Thus the graph says that there were about 115 simulations for which, at time 50, Sales Force was between 40 and 80 and about 50 simulations in which it was between 80 and 120.