| Ø | Double click on the Runname editing box and type a name for the dataset, e.g., run2. Click the Simulate button. |
After the model simulates use the Datasets Control to unload any previous runs then:
| Ø | Double click on Work Done, then click on the Analysis tool Graph. |
Output is generated showing the behavior of Work Done for one subscript: design.
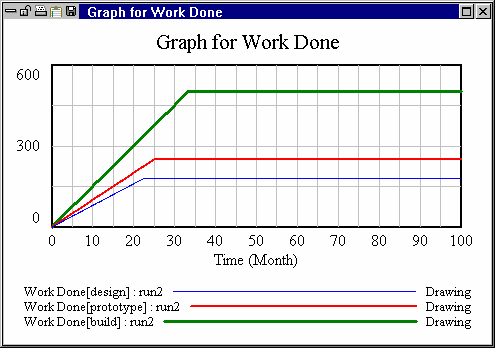
| Ø | Click the Subscript Control button on the Toolbar. The Subscript Control opens. Click on the button All, then click again on the Graph tool. |

Because all subscripts are selected, the work done for each task is graphed. Any Analysis tool you invoke will generate output that will reflect which subscripts are selected in the subscript control.
| Ø | Click on total work done then click on the Causes Strip graph. |
Output is generated showing the behavior of the variable total work done and its causes, Work Done for each of the three tasks. In this case, the number of subscripts selected is irrelevant: all are shown because all are causes of total work done.