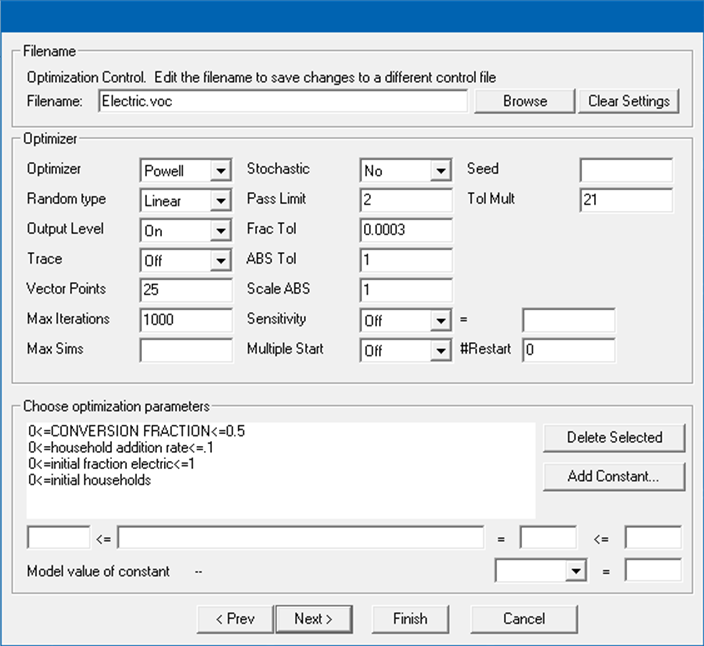
Once the payoff is defined, the Optimization Control needs to be set up. Optimization files have the extension .voc (Vensim optimization control) and by default have the same name as the model (e.g., electric.voc for this model). For this example, we will only enter the model parameters for the optimizer to vary, along with the (optional) maximum and minimum bounds for each parameter.
| Ø | Click on the + button and select conversion fraction. Type 0 in the minimum box (left hand box, <=), type 0.5 in the maximum box (right-most box, <=). |
| Ø | Click on the + button and select household addition rate. Type 0 in the minimum box (left hand box, <=), type 0.1 in the maximum box (right-most box, <=). |
| Ø | Click on the + button and select initial fraction electric. Type 0 in the minimum box (left hand box, <=), type 1 in the maximum box (right-most box, >=). |
| Ø | Click on the + button and select initial households. Type 0 in the minimum box (left hand box, <=). |
The Optimization Setup wizard should now look like:

| Ø | Click Next. |
| Ø | Click on the Data Sources… button and choose the dataset electric.vdf. You can also simply type this name into the editing box. |
| Ø | Click Finish. |
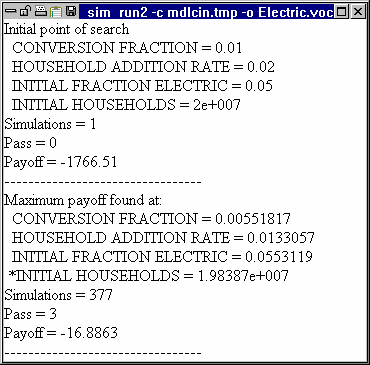
Vensim will perform multiple simulations on the model to find the optimum Constant values in order to fit the output with the real world data. The results of the optimization are displayed in an Output window, as below:

Maximum payoff, or best fit of simulation output with real data, is displayed as a number, and the Constant values required to achieve that payoff are listed. The best fit is saved as the current simulation dataset (run2).
Extra information about the optimization, including the best-fit values of the constants is saved in a .out file of the same name as the run (here it is run2.out).
| Ø | Double click on percent of US dwellings with electric power if it is not selected as the Workbench Variable. |
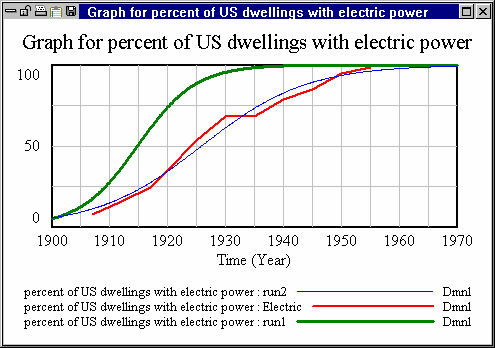
| Ø | Click on the Graph tool. You should see the three datasets, run1, run2, and electric, displaying lines for percent of US dwellings with electric power. |

The simulation run2 has a much closer fit to electric than does run1, our first attempt.