Graphical output from the Strip Graph, Sensitivity Graph, Bar Graph, Tree Diagram and Gantt Chart tool is exported as graphics. All other tools export the contents of the window as plain text.
Vensim exports directly to the clipboard. Text is exported without any special markings, although text from tables is exported in Tab delimited format. Graphics are exported in Windows Metafile format or PICT format on the Macintosh. Most Windows and Macintosh applications let you paste exported text from the Clipboard, and many also use the Metafile or PICT graphics format exported by Vensim.
Export Options (Not PLE or PLE Plus)
The Graphics tab of the Global Options dialog allows you to specify how you want exported graphics to go to the clipboard. You can force graphics to be sent in color or black and white, and also control the appearance of graph lines.
The Settings tab of the Global Options dialog also has a check box to have graphics exported printer-ready. This will cause the device resolution of the printer to be used in setting up the export. Depending on your computer and printer, exporting printer-ready can improve the ultimate appearance of your documents.
Export Size (Not PLE or PLE Plus)
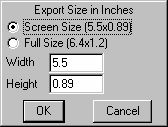
The Settings tab of the Global Options dialog also allows you to choose how Vensim sizes exported graphics. The options are Screen, Full and Query. If the size option is set to Full, Vensim allows the tools to determine their own desired size (which can be quite large). If the size option is set to Screen, Vensim makes the exported graphics the same size as the graphics on the screen. In this case, adjusting the size on the screen determines the size of the output. If the size option is set to Query, you will be asked how big to make the exported output, as in:

| • | Screen Size shows the size of the graphic as it currently appears on the screen. Clicking on this will set Width and Height to correspond to the displayed size. |
| • | Full Size shows the size desired by the tool to create the graphic. Clicking on this will set Width and Height to correspond to the desired size. |
| • | Width determines the width of the exported graphic. It is measured in inches or centimeters depending on the option you set in the Global Options dialog. |
| • | Height determines the height of the exported graphic. |
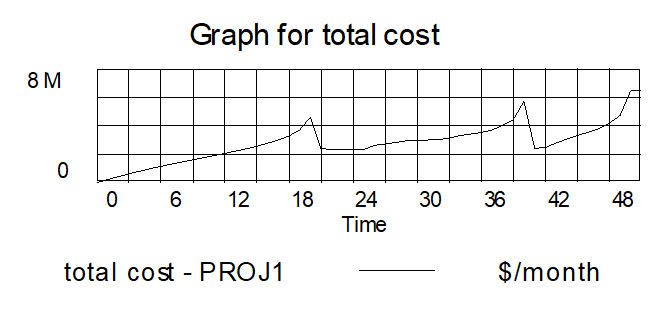
Because each tool responds to different size constraints, sizing a graph before exporting it can yield substantially different results than resizing after exporting. Consider, for example, output of the Graph tool that needs to be kept small. Resizing after exporting might yield:

whereas resizing and then exporting would give:

Depending on what you are doing, you might wish to resize before exporting.
NOTE For accurate sizing of exported graphics, set the sizing option to Query in the Global Options dialog, and enter the size you desire. Setting the sizing option to Screen, and changing the size on the screen will also work, but is less accurate.