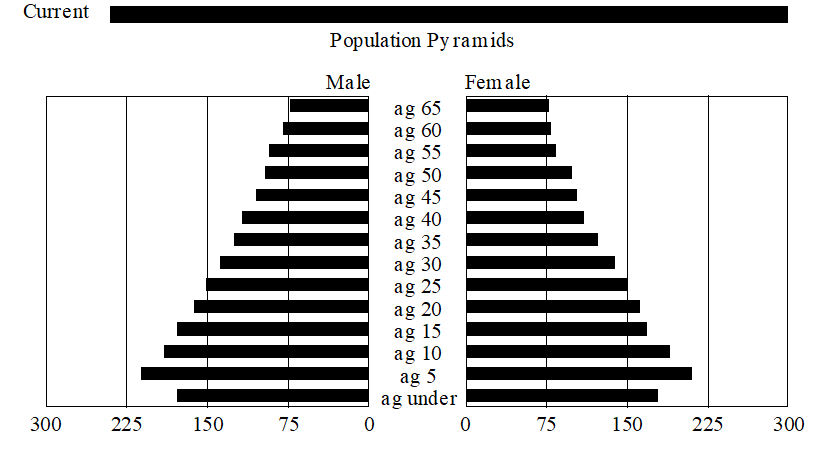
Custom bar graphs can be used to create and animate population pyramids. Consider a model that has population by age and sex with 5 year cohorts. The Bar-Graph definition
:BAR-GRAPH POPPYR
:TITLE Population Pyramids
:SUBTITLE Female
:OSUBTITLE Male
:WIP
:FORCE
:HORIZONTAL
:Y-MIN 0
:Y-MAX 300
:VAR Population Group[FEMALE,age group]
:OVAR Population Group[MALE,age group]
:SOFT-BOUNDS
Will give the result:

And this pyramid will be animated during a simulation. The model poppyr.mdl and the graph definition file poppyr.vgd can be used to experiment with this.