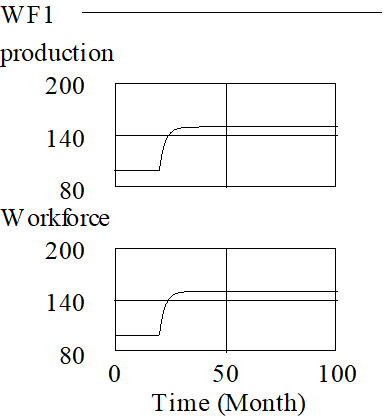
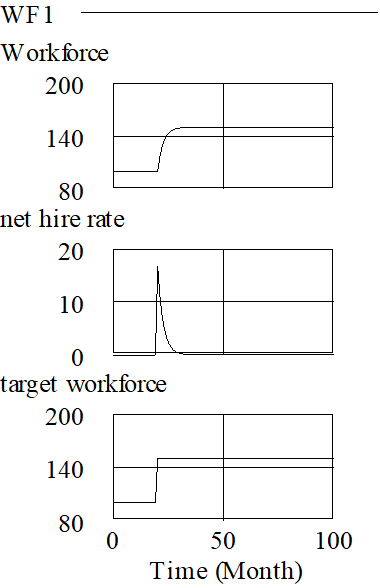
A Causes Strip graph for production and causes strip of Workforce show the dynamics.


It is immediately obvious that there is not a lot of variability in production or Workforce. There is very smooth adjustment from the initial 100 Widgets/Month to 150 Widgets/Month. Unlike our reference mode, the model does not appear to generate more variability in production than sales. At this point it is worth taking a look at Inventory.

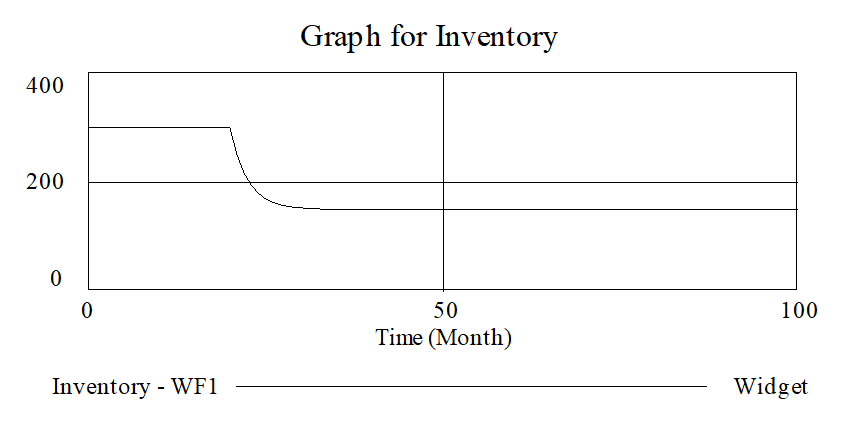
Inventory falls smoothly from its initial value of 300, to about 150. Since the purpose of holding an inventory is to be sure that the right product configuration is available for customers, there is clearly something wrong. Any discrepancy in Inventory from the level necessary to meet product mix requirements and have a comfortable safety stock needs to be corrected, and this model does not make that correction.