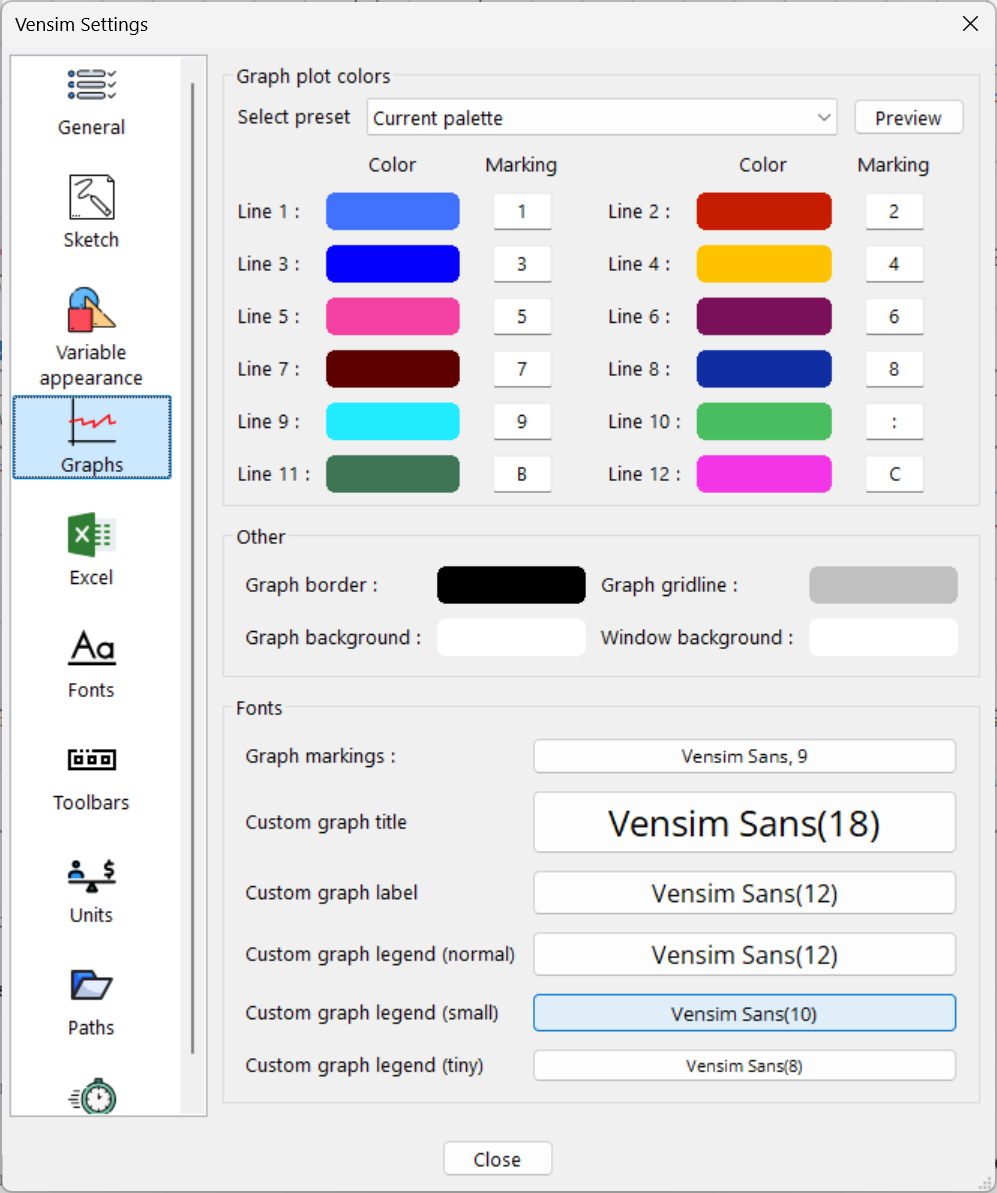
The Graphs tab is used to set up the colors that will be used in graphical output. Here you can set the colors of plot lines, as well as the graph background and foreground color and the line marking characters.
We have included a number of color vision deficiency friendly palettes since Vensim version 10.3. We are also happy to add more palettes to Vensim. If you suffer from a color vision deficiency, please contact us at vensim@vensim.com with either the RGB or HEX codes for the colors you use, we will add them to the next Vensim release.
Select preset Vensim has a number of pre-defined palettes that respect color vision deficiencies. You can select between these here, and display a live preview of what the various palettes look like. Colors 1-12 are the colors that are used to plot lines on graphs. Line 1 is used first, then 2 and so on. If there are more than 12 lines in a graph the colors will repeat. Marking 1-12 are the markings that will be used on graph lines. Markings are used only if Line Markers is set in the Graphics tab. Graph Border Color is used to draw the box around graphs, normally this is black. Graph Gridline Color is used to draw gridlines in graphs, normally this is gray. Graph Background Color is the color the graphs are drawn against. Making this an off-white color can provide a useful contrast in graph appearance. Window Background Color is the background color used outside the graph proper behind labels and other test. Fonts allows you to select the default font used by the graphs within Vensim. |
|
