![]()
![]()
![]()
The Tree Diagram tool creates a graphical representation of the structure of a model associated with the selected Workbench Variable. The Tree Diagram tool provides you with an easy-to-read, graphical representation of the causes and uses of variables. The Tree Diagram displays structural relationships (and not simulation results) and can therefore display information about a complex structure in a relatively small space.
The Tree Diagram tool is especially useful for general orientation and as a memory jogger.
Tree Diagram Options
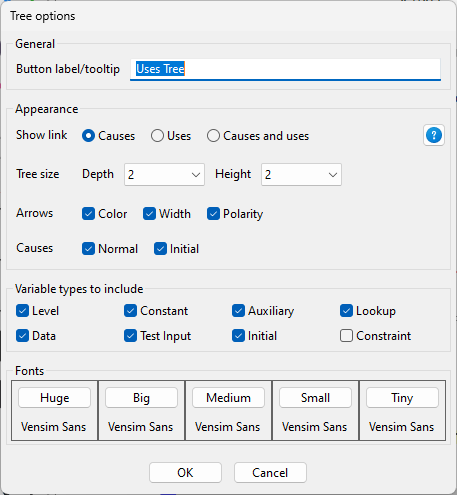
Tree size : This determines the initial Tree size.
Show behaviour : This shows mini graphs on each node on the causal tree.
Use sketch appearance : Arrows : This draws the tree using the arrow colors as found on the current sketch.
Use sketch appearance : Variables : This draws the tree using the variable appearance as found on the current sketch.
Font : This specifies the font to be used for the causal tree
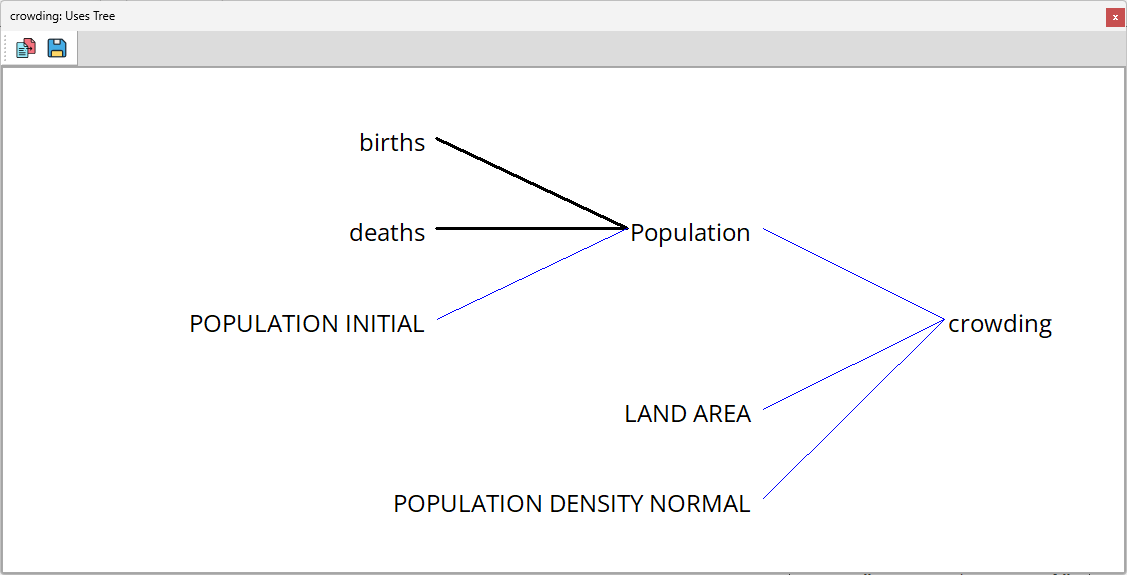
Tree Diagram Output
Each time you invoke the Tree Diagram tool a new window is created. This window displays the causes/uses of a variable as a tree. A variable name surrpunded with <> means that the variable appears elsewhere in the same diagram (indicating a feedback loop) and its further causes or uses are not shown. If you have set Capitalize by Type in the Global Options dialog, variable types are denoted using different case mixtures.
This is the output of the Tree Diagram tool for "Exposed" in a Covid model.
Tools
Copy : This copies the tree to the clipboard in bitmap format.
Save : This allows you to save the tree in SVG, BMP, PNG or JPEG formats.
Show behavior : This toggles display of thumbnail graphs for each node.
Fit to window : This forces the current tree to fit within the window.
Use sketch appearance : Arrows : This draws the tree using the arrow colors as found on the current sketch.
Use sketch appearance : Variables : This draws the tree using the variable appearance as found on the current sketch.
Functionality
When you hover over a node in the tree, if that variable has causes/uses, buttons will appear (
 ). These allow you to expand/contract the branches of the tree.
You can also pan/zoom around the tree if it is too large using the same mouse actions as you use on a normal Vensim sketch.
If the Tree Diagram tool is too large to be displayed clearly on the screen, you will be asked if you want to see it anyway. Depending on your relative printer/screen size, it might still be possible to print such a Tree Diagram. Note that when printing a Tree Diagram, Vensim will always put the whole diagram on a single page.
NOTE The Tree Diagram tool ignores subscripts. It operates on the Workbench Variable and selects causes and uses from the union of all possible causes and uses, for all subscript values.