Custom Tables allow you to look at tabular output from different variables at different times.
| Ø | Click on the Control Panel button |
| Ø | Click the New Table button. |
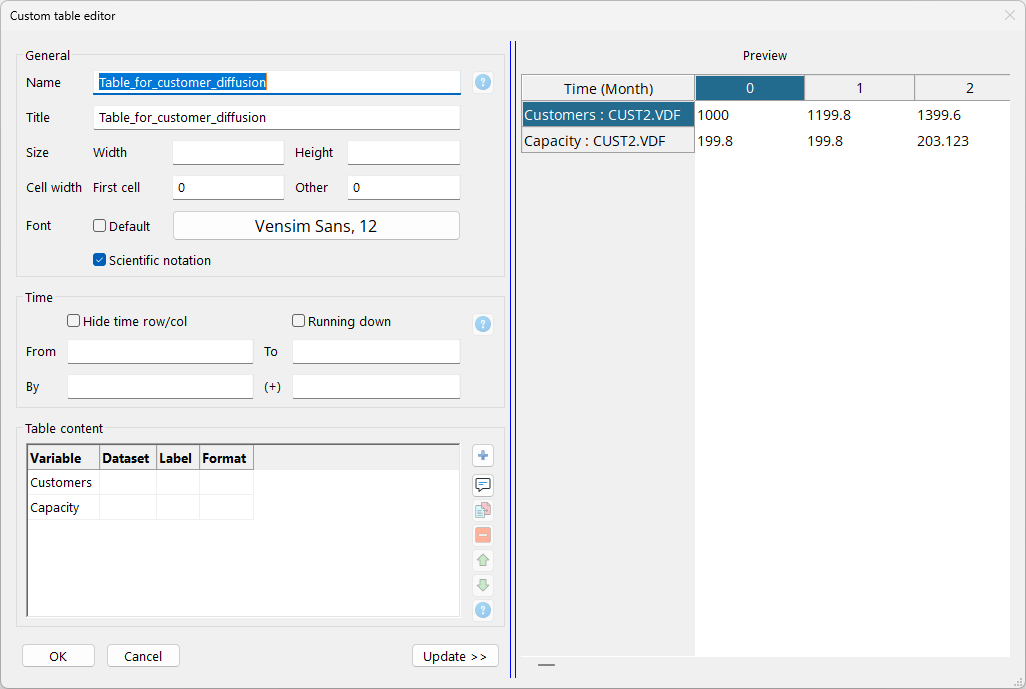
| Ø | In the graph dialog that opens click on the As Table... button at the bottom. The Custom Table Editor will open. |
| Ø | Type in the title Workforce Inventory Table. |
| Ø | Click on the Variable button and select Workforce then click on the Add button at the right. |
| Ø | Click on the Variable button and select Inventory then click on the Add button at the right. |
The dialog should look like:
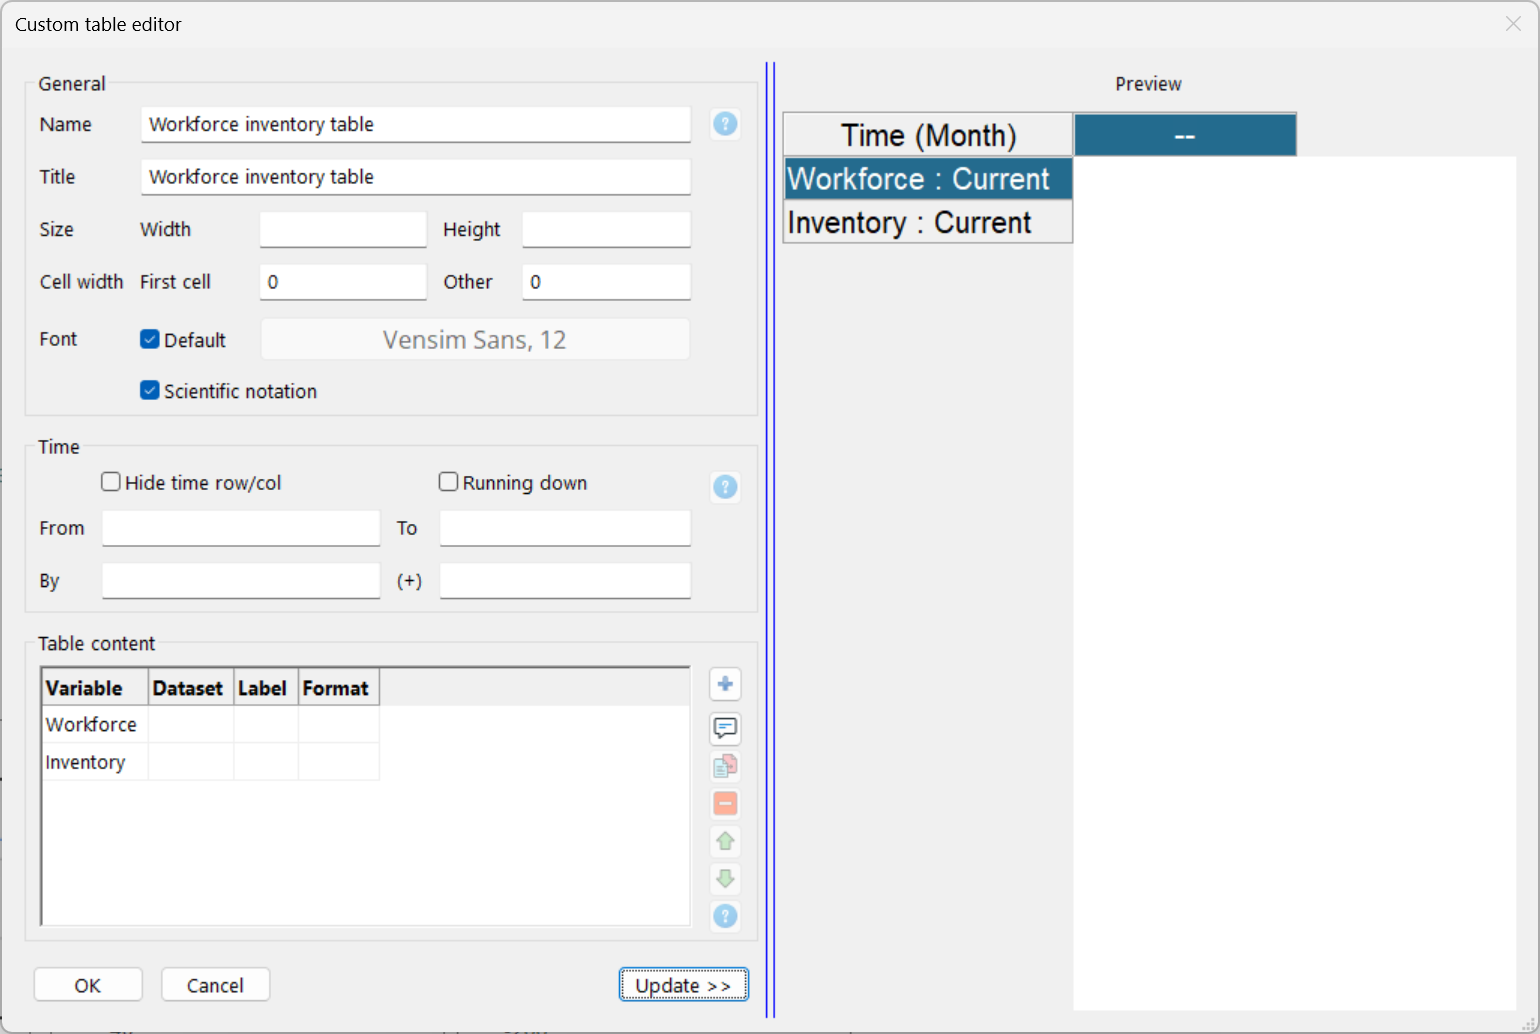
| Ø | Click on OK |
The list of available graphs and tables will be updated. Notice that the name will appear as WORKFORCE_INVENTORY_TABL - the final E is truncated. You can also type in the name you would like to see in the list in the Table Name editing box.
| Ø | In the control panel double click WORKFORCE_INVENTORY_TABL in the list. |
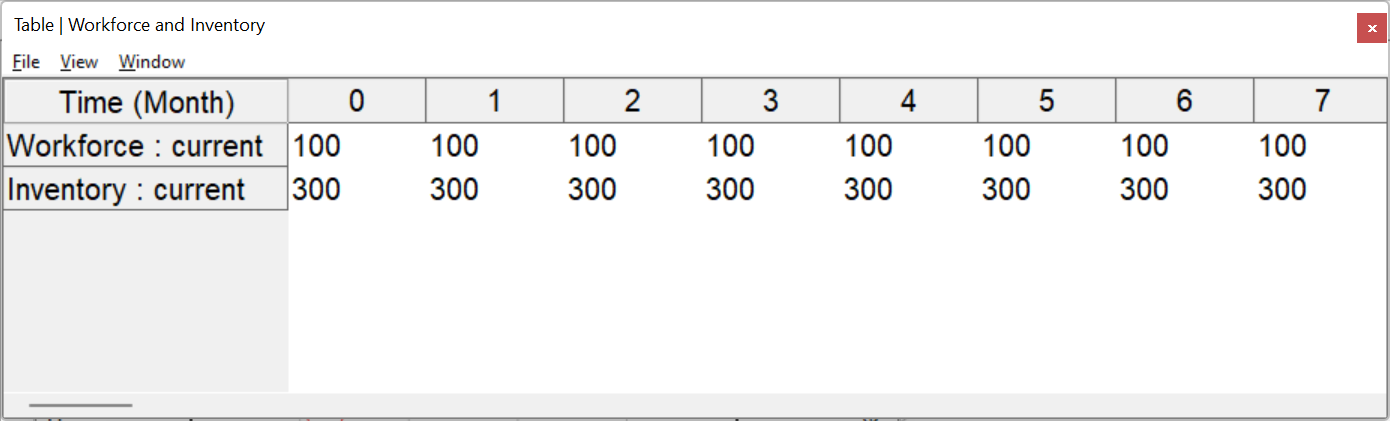
You will see the output