| Ø | Click on the Level Rabbit Population in the sketch. This selects it as the Workbench Variable. Check the title bar at the top of the Vensim window to see that Rabbit Population is selected. |
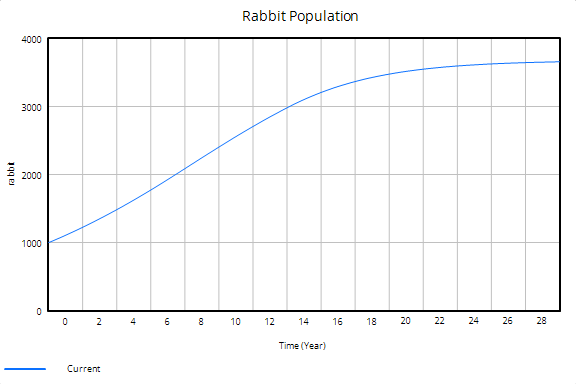
| Ø | Click on the Graph tool. A graph of Rabbit Population is generated: |

We can see that the Rabbit Population first grows exponentially then grows at a slower and slower rate until it eventually approaches a maximum value of approximately 3500 (because of the effect of the Lookup table).