| Ø | Click on the Simulate button to simulate the model. |
| Ø | Select the menu item View>Show Behavior or press the B key. |
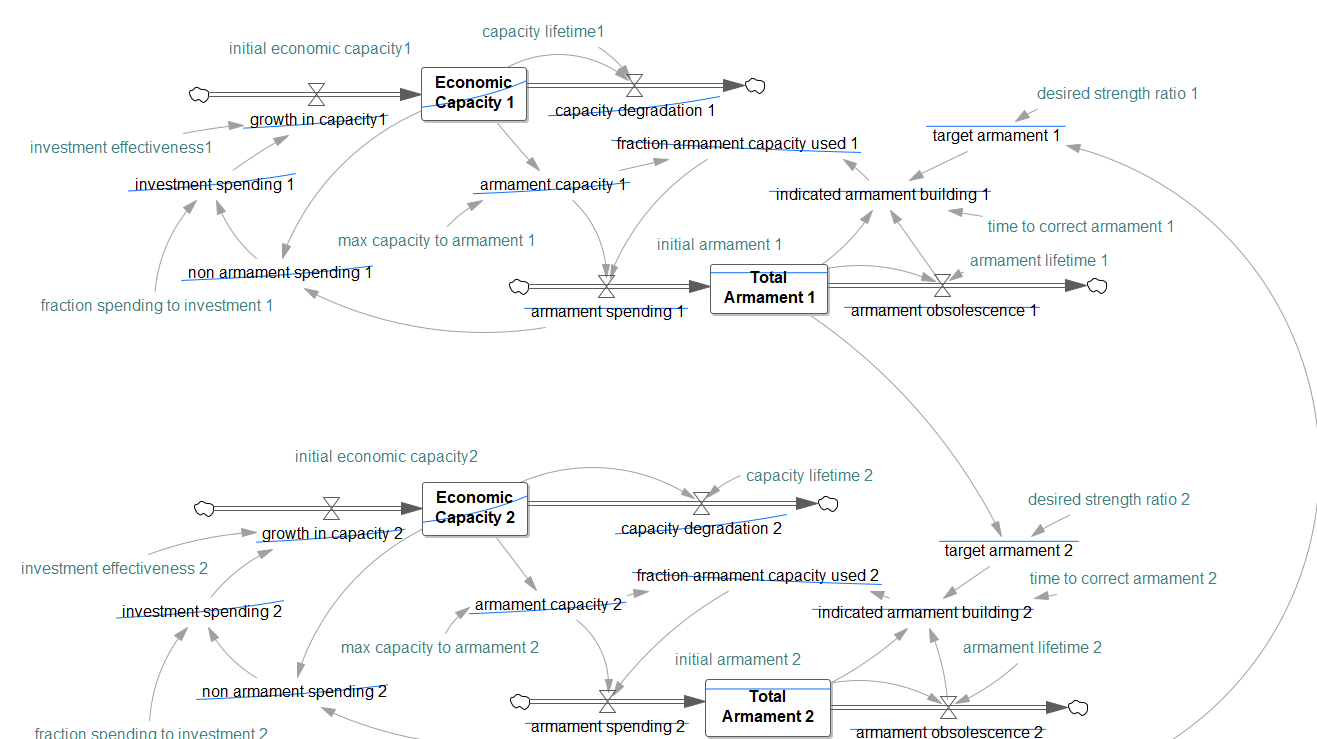
Instead of just a diagram you will see:

The behavior over time for each of the dynamic variables is displayed directly on the sketch. You can work with the sketch, move words and arrows and change equations with behavior showing.
If you make a number of simulations each one will show with a different color on all of the thumbnail graphs. By loading and unloading toolsets from the control panel you can control what is displayed. There is an example of doing this later in the chapter.