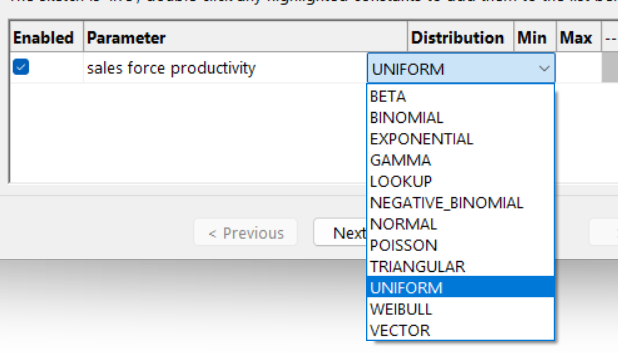
In order to do sensitivity simulations you need to define what kind of probability distribution values for each parameter will be drawn from. The simplest distribution is the Random Uniform Distribution, in which any number between the minimum and maximum values is equally likely to occur. The Random Uniform Distribution is suitable for most sensitivity testing and is selected by default. Another commonly-used distribution is the Normal Distribution (or Bell Curve) in which values near the mean or more likely to occur than values far from the mean.
Vensim provides a variety of different distributions to choose from. The most commonly used distributions are the Uniform, Normal and Triangular distributions. If you do not have any reason to choose a specific distribution sticking with a uniform distribution is usually sensible.
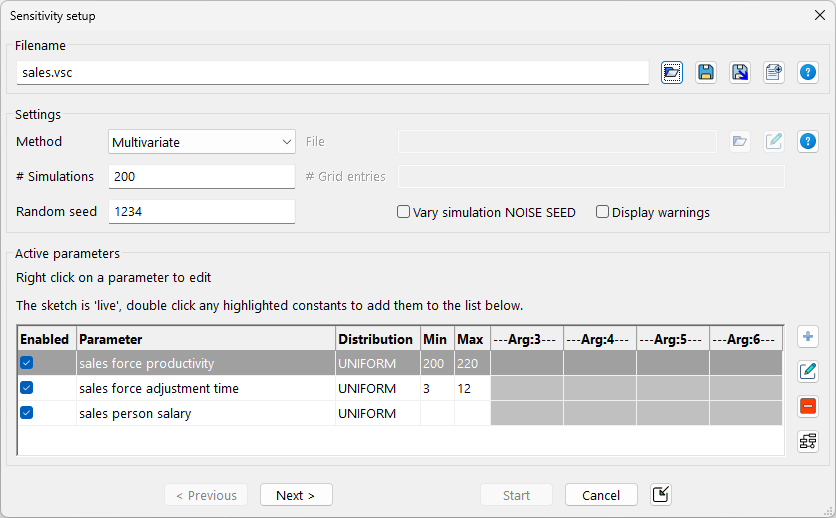
Minimum and maximum values are chosen to bound each parameter. Note the actual model value of 210 showing below the Parameter button.
| Ø | Click on the box labeled Minimum Value and type in 200. Click on the box labeled Maximum Value and type in 220. |
The minimum value of 200 represents the lowest productivity we think the sales force can achieve; the maximum value of 220 represents the highest productivity we think they can achieve.
| Ø | Click on the Parameter button and click on sales force adjustment time and click OK. |
| Ø | Click on the box labeled Minimum Value and type in 3. Click on the box labeled Maximum Value and type in 12. These figures are asymmetrical around the model's value of 6; we think the value might be a little lower or a lot higher. Click on the button Add Editing. |
| Ø | Click on the Parameter button and click on sales person salary and click OK. |
| Ø | Finally enter "sales" as the filename at the top of the dialog. You should now have something like this. |