| Ø | Click on the Sensitivity Graph |

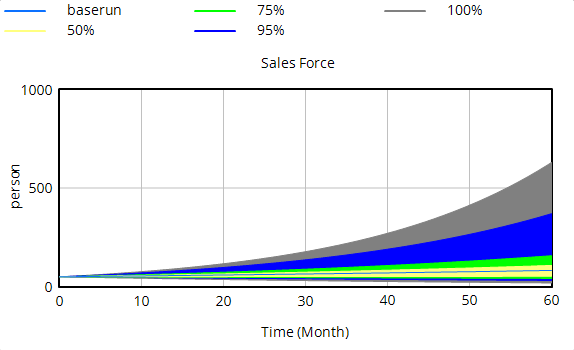
A graph is generated showing confidence bounds for all the output values of cash flow that were generated when the three parameters were randomly varied about their distributions. You can expand the graph to full screen by clicking on the maximize/minimize button just left of the close button in the upper right corner.
The outer bounds of uncertainty (100 %) show maximum values of approximately 10 million dollars and minimum values of approximately 500 thousand dollars at the end of the simulation. Note the possibility of a decline in cash flow. The first simulation run (with the values of the Constants contained in the model) is plotted as a line indicated by the run name sensitivity.
Mean Values (Not PLE Plus)
A mean value lies in between the confidence bounds, and can be plotted by:
| Ø | Click with the right mouse button on the Sensitivity Graph tool. Click on the check box Plot Mean Value in the Show Sensitivities as: field. |
| Ø | Click on the check box Suppress first run plot. (This will leave only the mean value and confidence bounds.) Click OK. |
| Ø | Click on the Sensitivity Graph tool. |
A plot is generated showing the mean value of the confidence bounds as a red line.