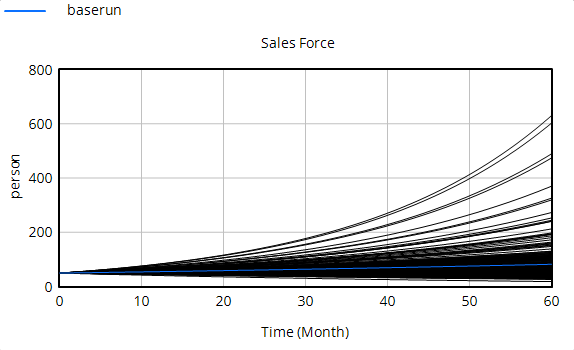
Another option in viewing sensitivity output is to view all the individual simulation traces. In Vensim PLE Plus click on the lower sensitivity graph  . For other configurations first adjust the options:
| Ø | Click with the right mouse button on the Sensitivity Graph tool. Click on the radio button Individual Traces in the Show Sensitivities as field then click OK. |
| Ø | Click on the Sensitivity Graph. |
Individual traces for each simulation are now plotted. You might want to maximize this graph (if not already maximized) to full window size in order to discern some of the individual traces.

| Ø | Double click on Sales Force then click on the Sensitivity Graph. |
We see very similar behavior, which is not surprising since the behavior of the feedback loop through Sales Force directly governs the behavior of cash flow.