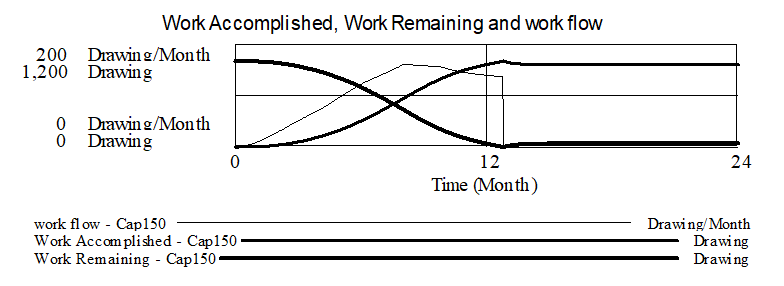
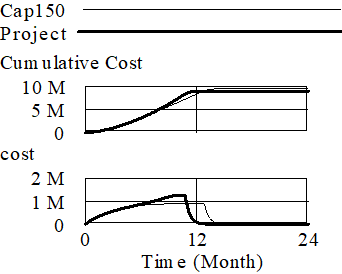
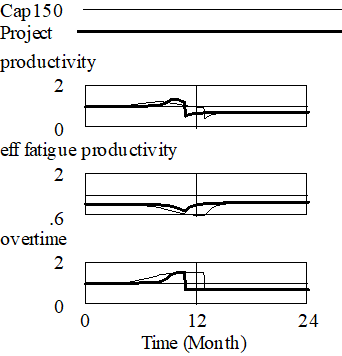
Now do an experimental simulation in which labor is capped at 150. You should get the results:

The project stretches out a little bit. If we look at cost, however, the results are a little surprising. Cumulative Cost is higher with the cap in place. Lets look at why:
Select Cumulative Cost into the Workbench and click on the Causes Strip tool (be sure to go to the Time Axis Control and click on the Reset button). If you don't have the right runs loaded go to the Datasets Control (Control>Datasets command):
Now clicking on the Causes Strip graph shows the causes of Cumulative Cost.

Costs do not rise as high, but they continue for longer and add up to more. Now select productivity and click the Causes Strip graph:


productivity never rises significantly. Schedule pressure comes in early, and leaves a fatigued workforce. Quality is also much lower. As the base model is configured the project finishes in a flurry of activity before anyone has had time to be burned out.