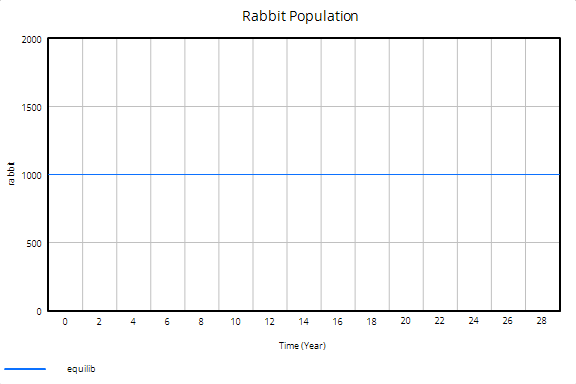
This model has been designed to show equilibrium conditions in the rabbit population. The constants birth rate and average lifetime are both set to generate a rate of flow of 12.5 % of Population, therefore each feedback loop is balanced numerically, resulting in no change in the value of Population.
Graph and Table tools
| Ø | Click on the Level Population in the sketch. |
This selects it as the Workbench Variable; another way to do this is to choose Population from the Variable Selection control. Check the title bar at the top of the Vensim window to see that Population is selected.
| Ø | Click on the Graph tool. A graph of Population is generated: |

Population appears as a flat line at the top of the graph at 1000 rabbits. To check that no change is occurring:
| Ø | Click on the Table tool. |
An Output window shows that Population is unchanging. Scroll the window to confirm that late in the simulation, Population is still 1000.
