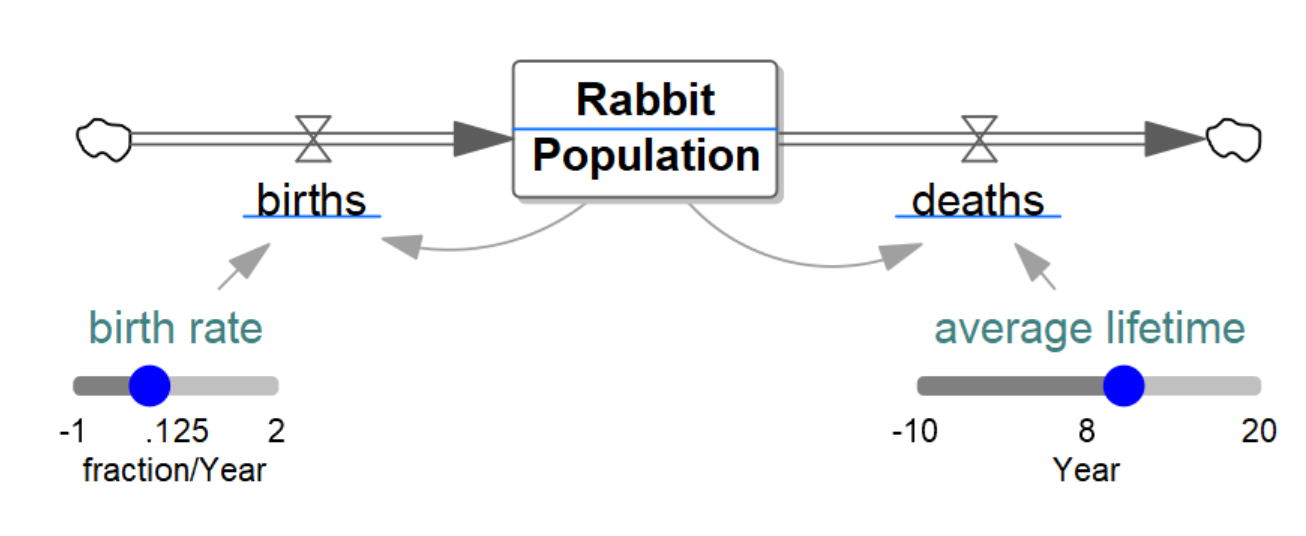
| Ø | Click on the SyntheSim button |
The toolbar will change to

and you will see variable behavior for all elements on the diagram.

| Ø | Click on the Runname editing box and replace equilib with the name growth. |
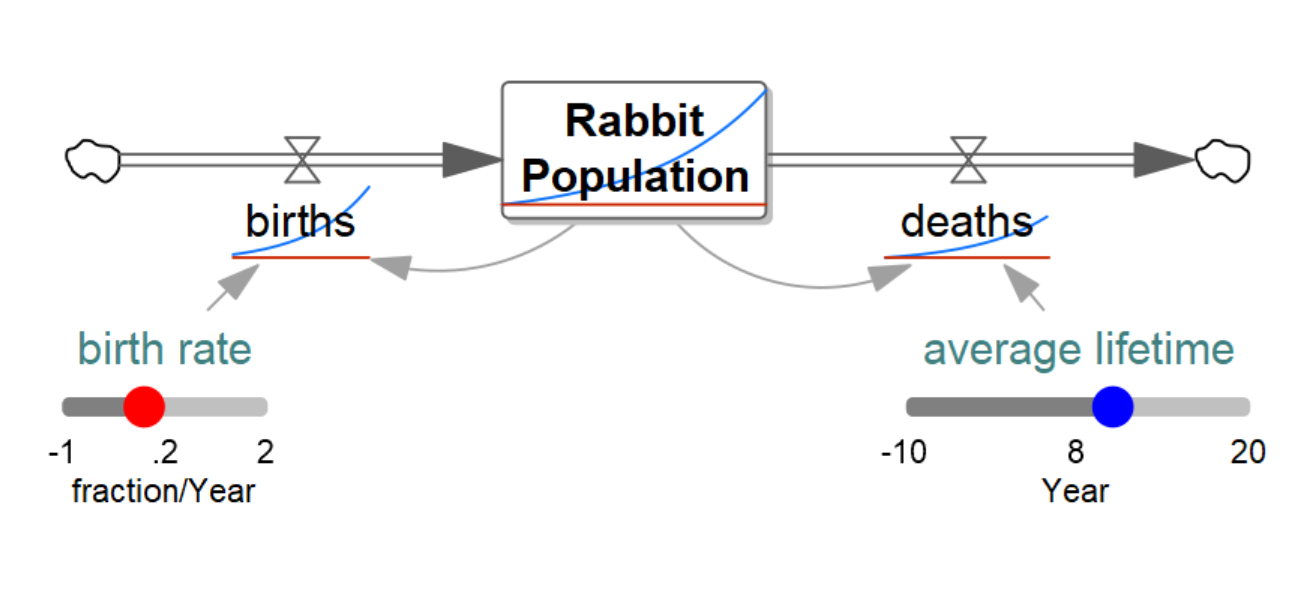
| Ø | Drag the slider beneath birth rate up till it shows 0.2 as its value. If you have trouble getting the exact value let go of the mouse button and use the left and right arrow keys on the keyboard to move the slider in small increments. |
Your sketch should look like:

The blue lines show the current run and the red line the equilib run results.
| Ø | Click on the Stop button to stop SyntheSim. |
The behavior graphs and sliders will disappear from the sketch.
| Ø | Press the B key or select the menu item View>Show Behavior to see behavior graphs again. |
You can toggle between seeing and not seeing behavior graphs by pressing the B key.