You can use Input Output Objects to imbed sliders, graphs and tables in a sketch. We will demonstrate this here by embedding a custom graph.
| Ø | Click on the Control Panel button and then select the Graphs tab. |
| Ø | Click on the New button. The Custom Graph editor will open. |
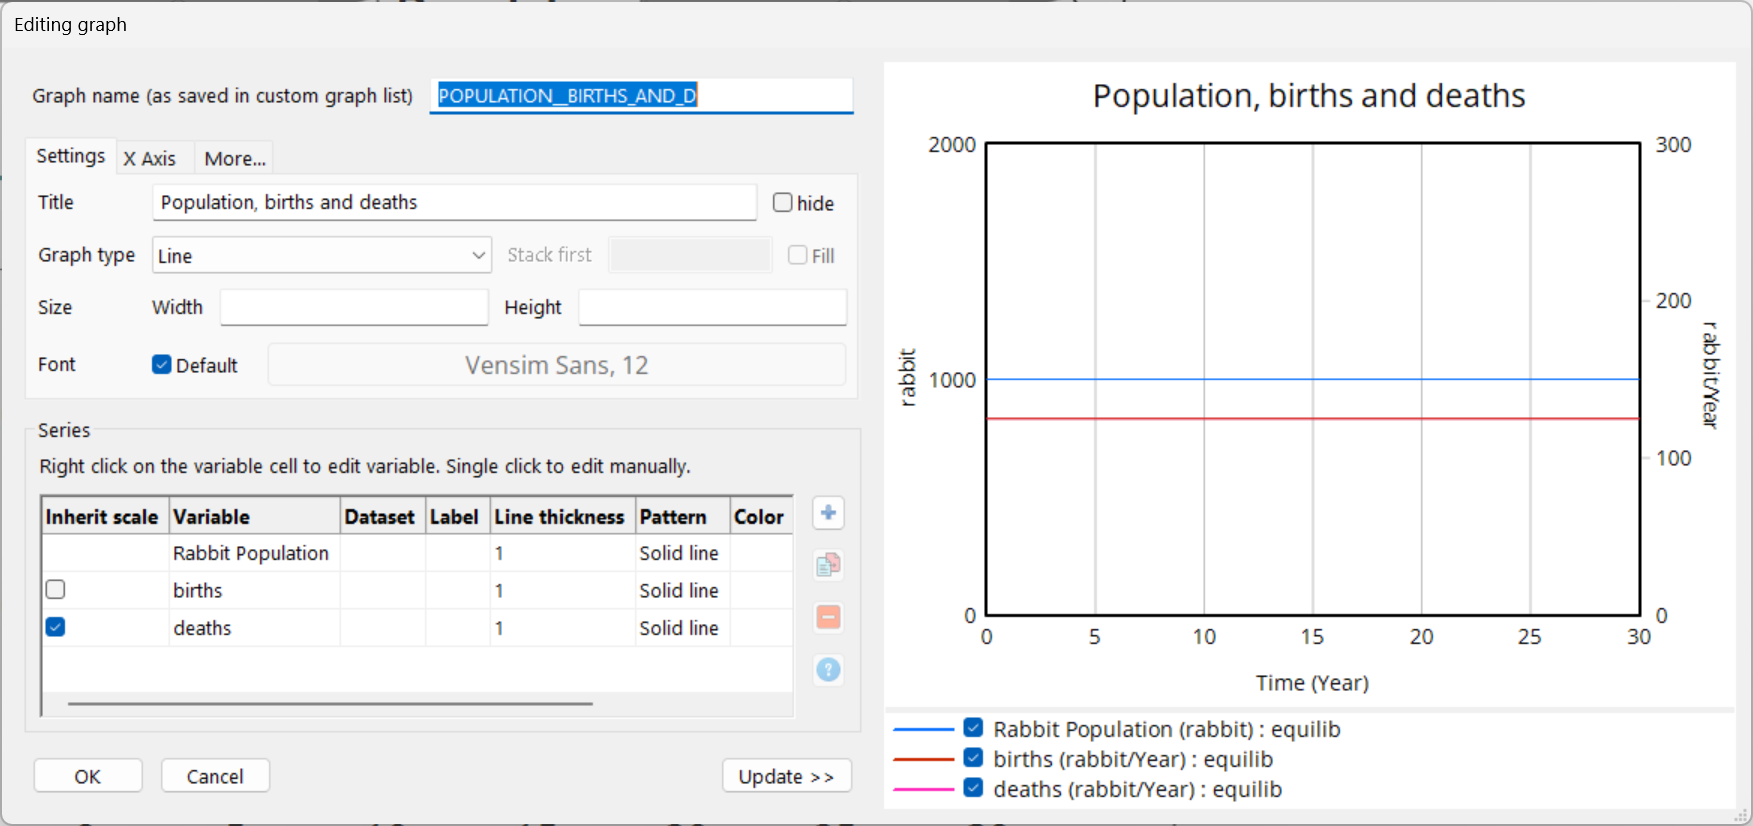
| Ø | Enter the title "Population, Births and Deaths." |
| Ø | Click on the first Sel button and select Rabbit Population from the list. |
| Ø | Click on the second Sel button and select births from the list. |
| Ø | Click on the third Sel button and select deaths from the list. |
| Ø | Click on the Scale checkbox to the left between births and deaths. |
The custom graph editor should look like:
| Ø | Select the Input Output Object sketch tool, and select "Workbench tool/Custom graph/Custom table" |
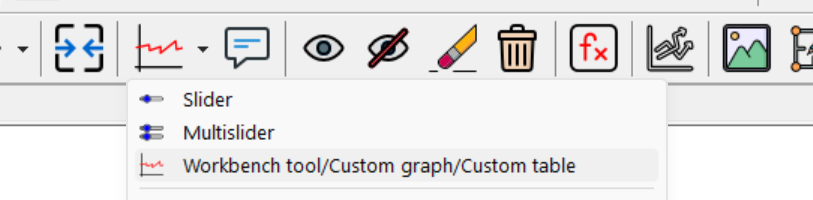 .
.
NOTE If you forgot to stop SyntheSim mode the Sketch toolbar will be grayed. Click on the Stop button then try the above step again.
| Ø | Click on an empty area of your sketch, below or to the right of the diagram. |
The Input Output Object dialog will open.
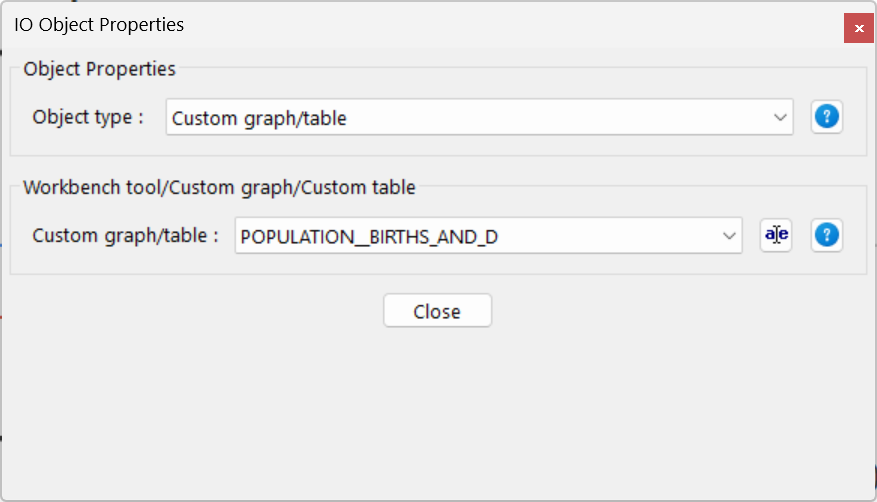
| Ø | Click on the Output Custom Graph radio button. |
| Ø | From the dropdown below Custom Graph or Analysis Tool for Output select POPULATION_,BIRTH_AND_D - it should be the only entry available. |
| Ø | Position and size the graph to fit your taste. |
| Ø | Double click on the run name and replace decay with experiment. |
| Ø | Click on the SyntheSim button. |
| Ø | Experiment with moving the sliders around and seeing the results on the graph. |
Chapter 12, Input and Output Controls has more details on customizing the information displayed on the sketch.