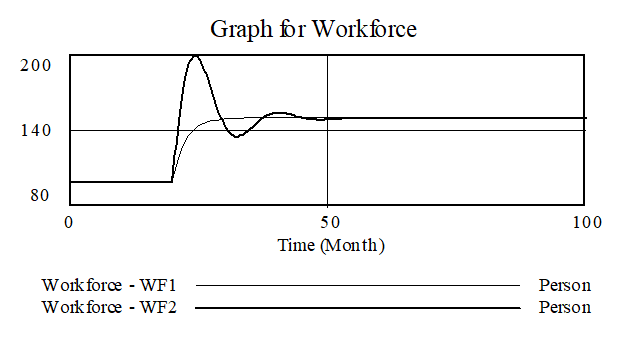
The model is simulated and the run named WF2. First generate a graph of behavior for Workforce with datasets from both runs loaded WF1 and WF2.

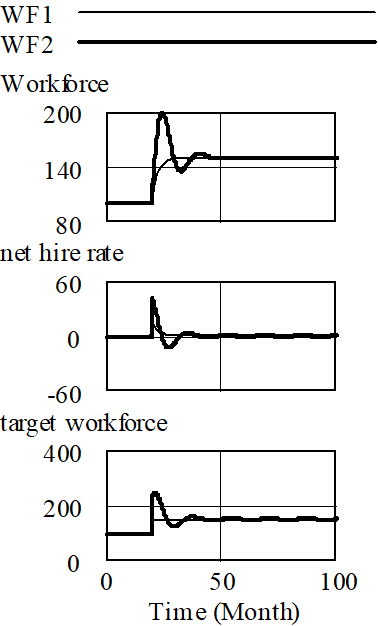
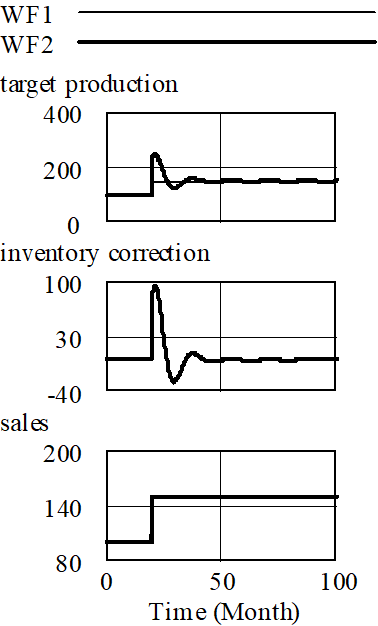
The behavior is dramatically different from the earlier model. Workforce is less stable and there is oscillation. Causal tracing is performed on Workforce, and on target workforce (graph not shown) and target production, and the output shown below:


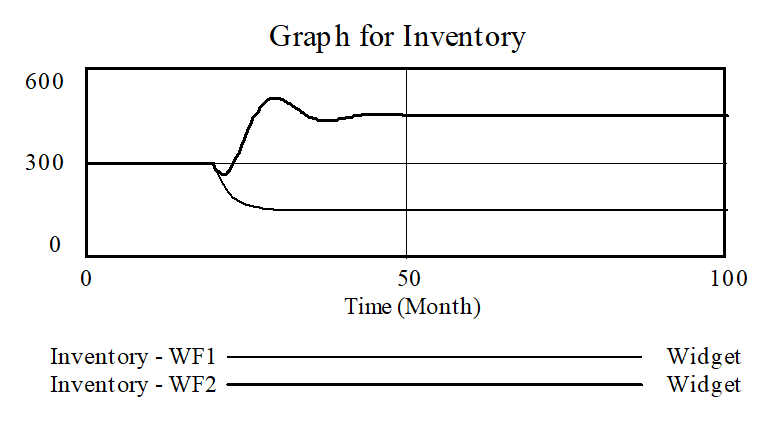
inventory correction was not in the first model. Therefore there is no plot from WF1 for inventory correction. All the oscillatory behavior in target production is due to inventory correction. A graph of Inventory shows similar oscillation, but a different final value from the first run. When sales increase, inventory now eventually adjusts to a new, higher desired level, rather than falling as before.
