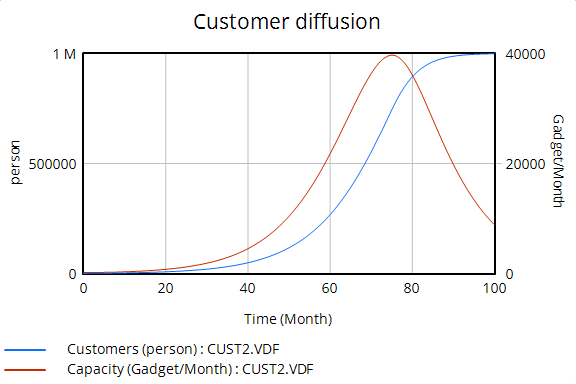
You activate customized output from the Graph tab of the Control Panel. Click on the Control Panel button in the Main Toolbar or select the Windows>Control Panel menu item. This control displays a list of the named graphs. Select one, click on the Display button and the selected graph will appear on the screen. Errors occurring while creating output, if any, can be reviewed in the Vensim Error Log window, which can be made visible using the Windows>Error History command.
