
The Runs Compare tool compares the values of variables between two loaded datasets - the first and second by default, or any two you select in the Dataset Manager and compare from there. If the values of variables are different, or if variables in one run are missing from the other run, this is reported. A dataset can be compared with a run, which is the usual way to see how far a model is from the data it was fitted to. A dataset holds data variables and nothing else, so such a comparison covers data alone: the type filters are unavailable, and the Constants, Lookups and Constants matrix pages say why they are empty. Imported datasets and .tab, .csv and .dat files loaded as data all compare this way. The intermediate variables a macro creates, whose names begin and end with #, are compared only when Show macro variables is set.
The Runs Compare tool is most useful when the runs are from the same, or very similar models. The order in which the runs are loaded can influence the order in which differences are reported, but will not change the content.
Runs Compare Options
The Run Compare tool lets you select which type of variables you would like to compare, and the threshold of difference that is required before any differences are reported.
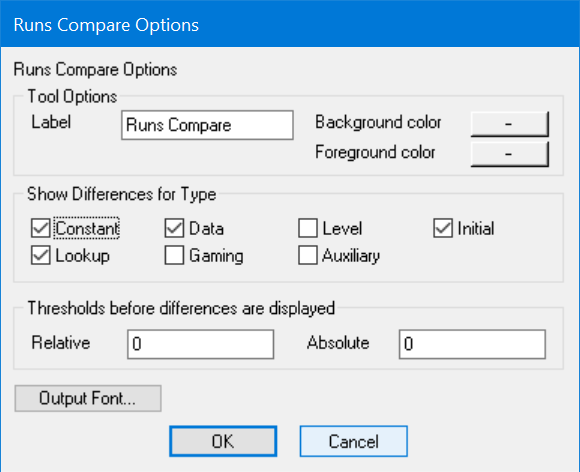
Show Differences for Type allows you to select the different types of variables to show differences for. Note that Gaming is actually a subset of Auxiliary. It is included as a separate category for comparison of Gaming simulations. At least one type has to be selected: with none, the tool would have nothing to compare and could only report that it found no differences.
Thresholds before differences are displayed lets you specify these thresholds. The difference must exceed the value for Relative times the original value and also exceed the value for Absolute before the difference is reported. Relative defaults to 1e-7 and Absolute to zero. Both thresholds also appear on the Runs Compare toolbar, where changing one re-runs the comparison. Set there they apply to that window; set here they are what a new comparison starts from.
A Relative threshold of zero reports small differences that earlier versions did not show, and a workbench saved before this release carries one. Constants in a .vdfx are stored in double precision, but the comparison used to narrow both values to single precision before testing them, so a pair that agreed to about seven digits was reported as identical. They are now compared as stored. Setting Relative to 1e-7 gives the earlier behaviour, because a difference the old comparison could not see falls below that threshold. New toolsets start at 1e-7.
The Runs Compare Window
Each comparison opens its own window, in three parts: a table of the settings the two runs were made with, a Constants page and a Time series page. The tab on each page carries the number of rows it holds. If the runs are identical the window says so rather than opening an empty table.
The settings table has a row per setting and a column per run, and lists only the settings at least one of the runs used. Where the two runs differ, the values are shown in red. Vensim records how a run was made as the command line it built at the time, so anything that command line does not record - the time bounds, for instance - cannot be shown here.
Constants and initials go on the Constants page, which shows the value in each run. Everything that varies over time goes on the Time series page, which shows the first time at which the two runs differ, the values there, and the difference statistics. Keeping them apart leaves out the statistics columns that are meaningless for a constant.
The columns, in order:
•Type - the type of difference (value difference, missing variable, and so on)
•Values - the value in each run: for a constant its value, for a time series the first pair of values that differ. A variable one run does not have is marked *** there, with the value from the run that does have it beside it. A subscripted variable has no one value, so its first element stands for the array, written [0.1, ...]
•Diff - the second run less the first
•%Diff - the same difference as a percentage of the mean of the two magnitudes
•At Time - the time at which the first difference occurs
•N Diffs - total number of differences (including those below the tool's threshold settings)
•N NA Diffs - instances where one series has a value and other is NA (where other statistics would be undefined)
•MAD - mean absolute difference
•MAD%Mean - mean absolute difference, divided by the mean of the absolute value of the defined points in both series
•MA%D - mean percent difference. Each point's difference is divided by the larger of the two magnitudes at that point, so this is bounded at 100% - not MAPE, which divides by one series and is unbounded
•MaxAD - largest absolute difference
•MaxAD%M - largest absolute difference, divided by the mean of the absolute value of the defined points in both series
•MaxA%D - largest of those per-point percent differences
•Mean/Slow/Fast RSSE - a heuristic decomposition (via wavelets) of differences into slow and fast components, useful for distinguishing substantial features from noise
The percentages are deliberately symmetric: there is no baseline run here, so swapping which run loaded first changes a percentage's sign but not its size. That does mean they read lower than you may expect. A constant that goes from 0.1 in one run to 1 in the other is ten times larger, which in ordinary use would be called a 900% increase; %Diff reports 163.6, because the difference of 0.9 is taken against the mean of the two magnitudes, 0.55. The per-point statistics divide by the larger magnitude instead, so the same pair gives 90 there. Both stay bounded - at 200% and 100% respectively - which is what keeps a value near zero in one run from producing a huge percentage and swamping the shading. When you want the ordinary ratio, read Values or Diff.
Note that the statistics are computed over all differences, not just those that exceed the thresholds.
The Lookups Page
A lookup is a table, so when one differs between the runs every point of it is reported, which is a series in x rather than the single value a constant has. That is why lookups have a page of their own. The count on the tab is the number of lookups that differ, not the number of rows. The page is not sorted: a sort would separate the two halves of every pair, and the points read in the order the table holds them.
Each lookup is a pair of rows, one per run, with the table laid out across the columns as x and y pairs, so the two curves read against each other point by point. The second row of the pair is shaded wherever it differs from the first: the y that moved, shaded by how far it moved. Two lookups can have different x grids; when they do the points are paired off in order, so the second row's x is marked instead and no difference in y is claimed, because the two y values sit at different places on the curve. A point one run has and the other does not is greyed. A lookup that one run does not have at all, or has as something other than a lookup, says so on that run's row instead of showing values that were never compared. How many columns the page has depends on the longest table it is showing.
The Constants Matrix
With three or more runs loaded, a third page compares the constants of every loaded run against the first, one row per variable and one column per run. The pairwise pages still compare the two runs you chose; the matrix answers the other question, which is which constants moved and where.
Alongside the variable and its type is Max %Diff, the largest difference from the first run anywhere in that row, and the page opens sorted by it. Cells are shaded by their own difference from the first run, so the runs that moved stand out across the row. A cell reads as the value in that run, or -- where the variable is not in that run, type where it is of a different type or shape there, and differs where it differs in a way with no single number, as a lookup does.
The matrix covers whichever of constants, initials and lookups the filters are showing, so it holds the same kinds of row as the Constants page. Initials are worth leaving off a subscripted model unless you want them: there is one for every element of every stock, which can be hundreds of thousands of rows. The thresholds in the tool options apply here too - a constant whose difference is below them is reported as matching the first run.
Sorting, Shading and Filtering
Click a column heading to sort by that column; a triangle in the heading shows which column is sorted and in which direction. The difference and statistic columns sort largest first, and Diff and %Diff sort by size regardless of sign, so one click brings the biggest differences to the top whichever way they went. Click again to reverse the order, and a third time to return to the order in which the differences were found. Names, types and times sort the other way round, smallest first.
%Diff cells are shaded by how large the difference is, on a logarithmic scale that starts at 1%, so a large difference stands out without sorting for it.
The Filters button on the toolbar chooses which types of variable the window shows, for this window only - the tool's own options are not changed. A type that was not in the options is compared the first time you show it, which on a large model takes a moment.
Clicking a name in the Variable column makes it the workbench variable, as does double clicking anywhere in its row.
Save writes the same tab-delimited file the command writes - one number to a row, with the run settings in it, for a spreadsheet or a script to filter and pivot. Copy puts what is on the screen on the clipboard instead, laid out as the window lays it out, which is what you want when pasting a table somewhere to read. See MENU>RUNCOMPARE for the columns.
Comparing Runs from a Command Script
A command script can run a comparison without opening a window, writing the differences to a tab-delimited file instead - one number to a row, for a spreadsheet or a script to filter and pivot rather than for a person to read. It can compare every loaded run against the first in one file, which is where a constants matrix comes from outside the window. See MENU>RUNCOMPARE.
The Runs Compare tool first tests the first loaded run against the second and reports differences by type in alphabetical order. After doing this, it checks whether the second loaded run has variables of the selected type that are not in the first run, or are of a different type there. So the rows found in that second pass follow the first pass rather than joining it in alphabetical order - until you sort the table, which puts them wherever they belong.
