The workforce/inventory model presented is relatively simple, although it may look confusing if you are not familiar with the conventions of stock and flow diagramming. In this visual representation, arrows imply cause and effect: the variable at the tail of the arrow causes the variable at the head of the arrow (to change). For example, production is caused by Workforce and also by productivity.
We can investigate the structure of this model with the structural Analysis tools. We will get answers only about structure, not about dynamic behavior of the model (that comes next when we simulate the model and use the dataset Analysis tools).
| Ø | Click on the top Analysis tool, the Causes Tree Diagram |

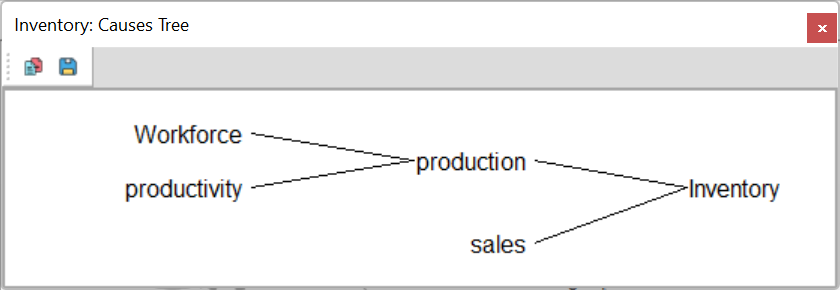
We see that the Workbench Variable, Inventory, is on the right and everything that causes it to change (up to 2 connections distant) is on the left.
| Ø | Click on the Uses Tree Diagram Analysis tool |

Now we can see the Workbench Variable on the left and where it is used in the model (what it causes to change, up to 2 connections distant) on the right. Note that these Tree Diagrams simply present information from the model in a different manner. We can observe all the causal connections by examining the sketch, but trees present only part of a model and can be easier to understand.
| Ø | Click the Close button or press the Del key to close the Tree Diagram. |
| Ø | Place the mouse cursor pointer on the variable net hire rate that appears in the sketch, and then click to select it as the Workbench Variable. |
| Ø | Click on the Loops Analysis tool |

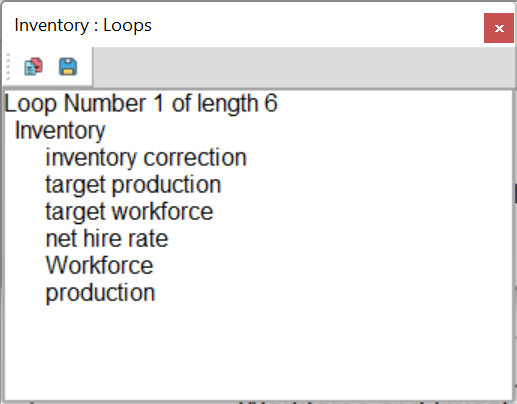
An Output window opens that displays all variables in all feedback loops (two) that pass through the Workbench Variable (net hire rate).
| Ø | Click on the Document Analysis tool |
The output of this tool will depend on the configuration of Vensim you are using. For Vensim PLE and PLE Plus the document tool provides documentation on the entire model, displaying all model equations in a simple text format. For the other configurations this information is displayed only for the current Workbench variable.

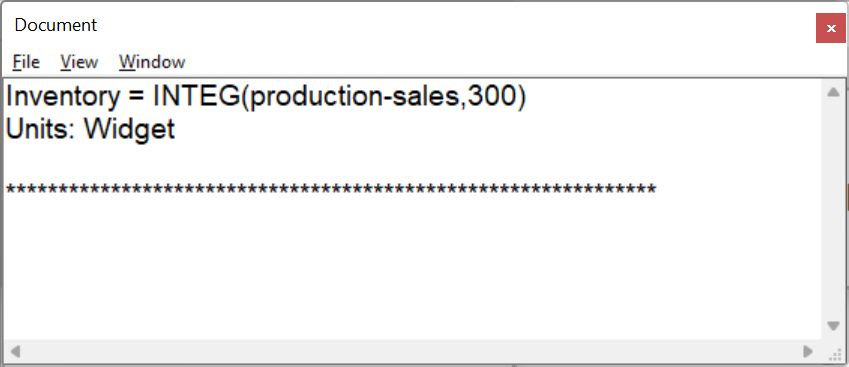
An Output window opens that displays the equation underlying the Workbench Variable (net hire rate) and the units of measurement.
| Ø | Select the menu item Windows>Close All Output. |
This closes all the Output windows that have been created.