| Ø | Click on Workforce to select it into the Workbench. |
| Ø | Click on the Graph Analysis tool  |

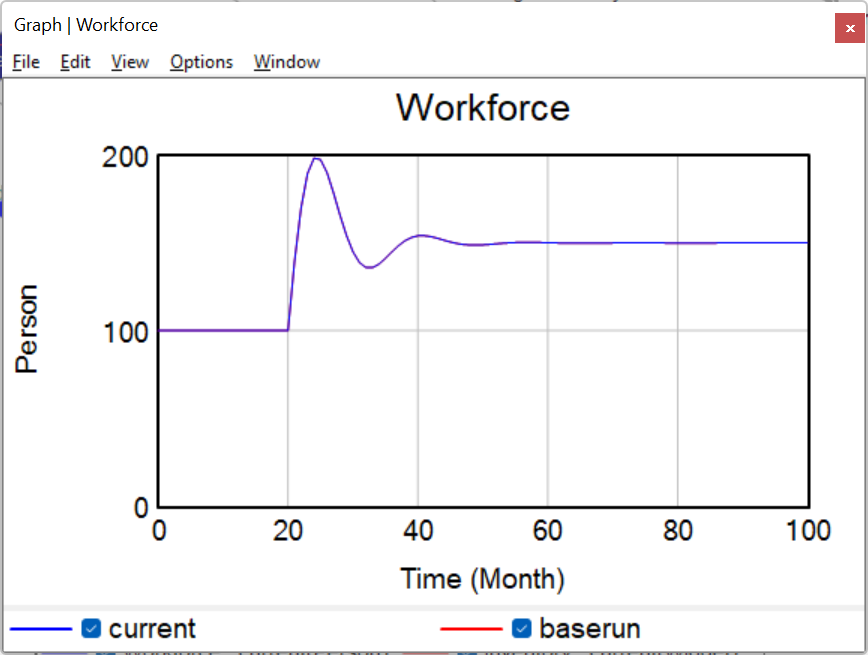
Two things are worth noting about the above graph. First both runs show a pattern of behavior known as damped oscillation. Second, the two runs are identical except for scaling.
| Ø | Close the graph by clicking on the Close button or pressing Del. |
| Ø | Click on the variable Inventory appearing in the sketch and then click on the Graph tool |

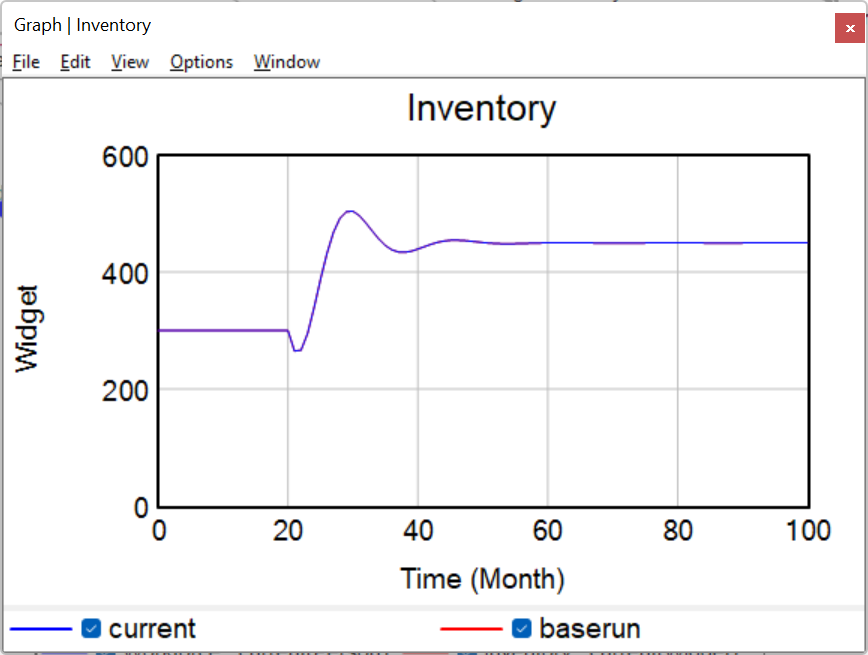
We see a graph of Inventory with oscillating behavior similar to workforce, although Inventory starts out by declining before increasing in value. More importantly, there is only one graph visible. Let's look at a table of the actual values for inventory.
| Ø | Click on the Table tool  |

| Ø | Use the bottom scrollbar of the Output window (or the left and right arrow keys) to look through the values for Inventory. |
Only one graph line is visible for Inventory because the values are identical for both runs. Changing productivity impacts only Workforce, target workforce and net hire rate.This is quite clear just by looking at the model diagram as you drag the slider and occurs because productivity really just scales the number of people required to produce one item.
| Ø | Click on the Reset Slider button  or press the Home key to return the value of productivity to its original setting. or press the Home key to return the value of productivity to its original setting. |
| Ø | Repeat the above experimentation process with each of the three remaining constants. Drag the sliders observing behavior and then bring up more detailed graphs when you see something interesting. |
The things to be looking for when you are evaluating behavior are the period of oscillation, the extent by which variables change and the degree of damping. The period of oscillation is the time from one peak to the next on the time graphs. Damping is the decrease in amplitude that occurs from peak to peak, where amplitude is the distance along the y axis from the eventual value the variable settles to. It should be easy to see that productivity and inventory coverage do not significantly change these while time to adjust workforce and time to correct inventory do.


