So far you have used the SyntheSim capabilities of Vensim to explore model behavior and this is an extremely efficient way to gain insights. There is a more traditional way to explore behavior, and this involves a setup step followed by a simulation step for each simulation made. This approach has the advantage of being very methodical, so that results are easily replicated by other people. This is also the only practical approach to dealing with very large models for which take more than a few seconds to simulate.
| Ø | Click on the Stop Simulating button |
The graphs and sliders will disappear. Vensim is now in the same state it was in when you first opened the model.
| Ø | Click on the Set Up Simulation button |
Some of the variable names in the sketch will appear with yellow text on a blue background. These are Constant variables that do not change during simulation; we can set them to a different value before we simulate and see the effect the changes have on model behavior.
| Ø | Click on the variable time to adjust workforce that appears yellow/blue on the sketch. |
An editing box will open: 
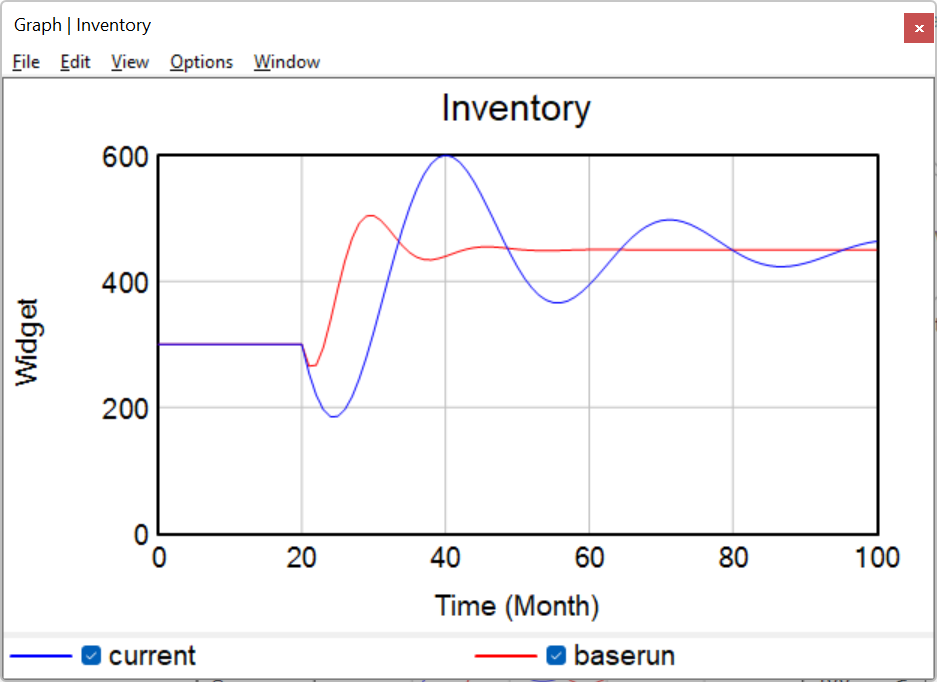
We will try an experiment where we slow the rate at which we hire new workers (and layoff current workers), to see if that removes the oscillation. Ideally we would like to see a smooth increase from our old inventory (and workforce) levels to the new levels.
| Ø | Type the number 12 into the editing box to replace the number 3, then press the Enter key. |
This will change the time to adjust workforce from 3 months to 12 months.
| Ø | Click on the Simulate button  on the Toolbar, the model will simulate and store the values for the dataset experiment. on the Toolbar, the model will simulate and store the values for the dataset experiment. |
| Ø | Click on the variable Inventory, then click on the Graph Analysis tool |

Here we see the results of two experiments: baserun with the original value (3) for the variable time to adjust workforce, and experiment with the modified value (12) for time to adjust workforce. The results show that slower hiring and firing practices actually increase the size of the oscillation, and make the oscillations last longer.
To see what the differences in the constants were for each run:
| Ø | Click on the Runs Compare Analysis tool |

The Runs Compare tool lists all Constant and Lookup differences in the first two loaded simulation datasets. We have two datasets loaded (baserun and experiment) and the only difference is the value for the variable time to adjust workforce (3 and 12).