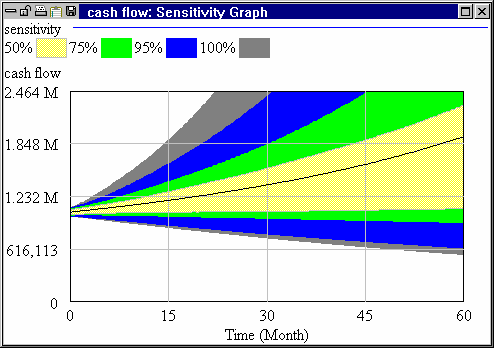
Let's focus the vertical scale to show greater detail in the lower range of uncertainty values.
| Ø | Place the pointer on the horizontal graph line that shows 2.5 M in cash flow. Hold down the Ctrl key then click and hold down the mouse button. Drag the mouse so the cursor moves down to the bottom of the graph (the graph line that shows 0 in cash flow). Release the mouse button. |
| Ø | Click on the Sensitivity Graph tool. |
