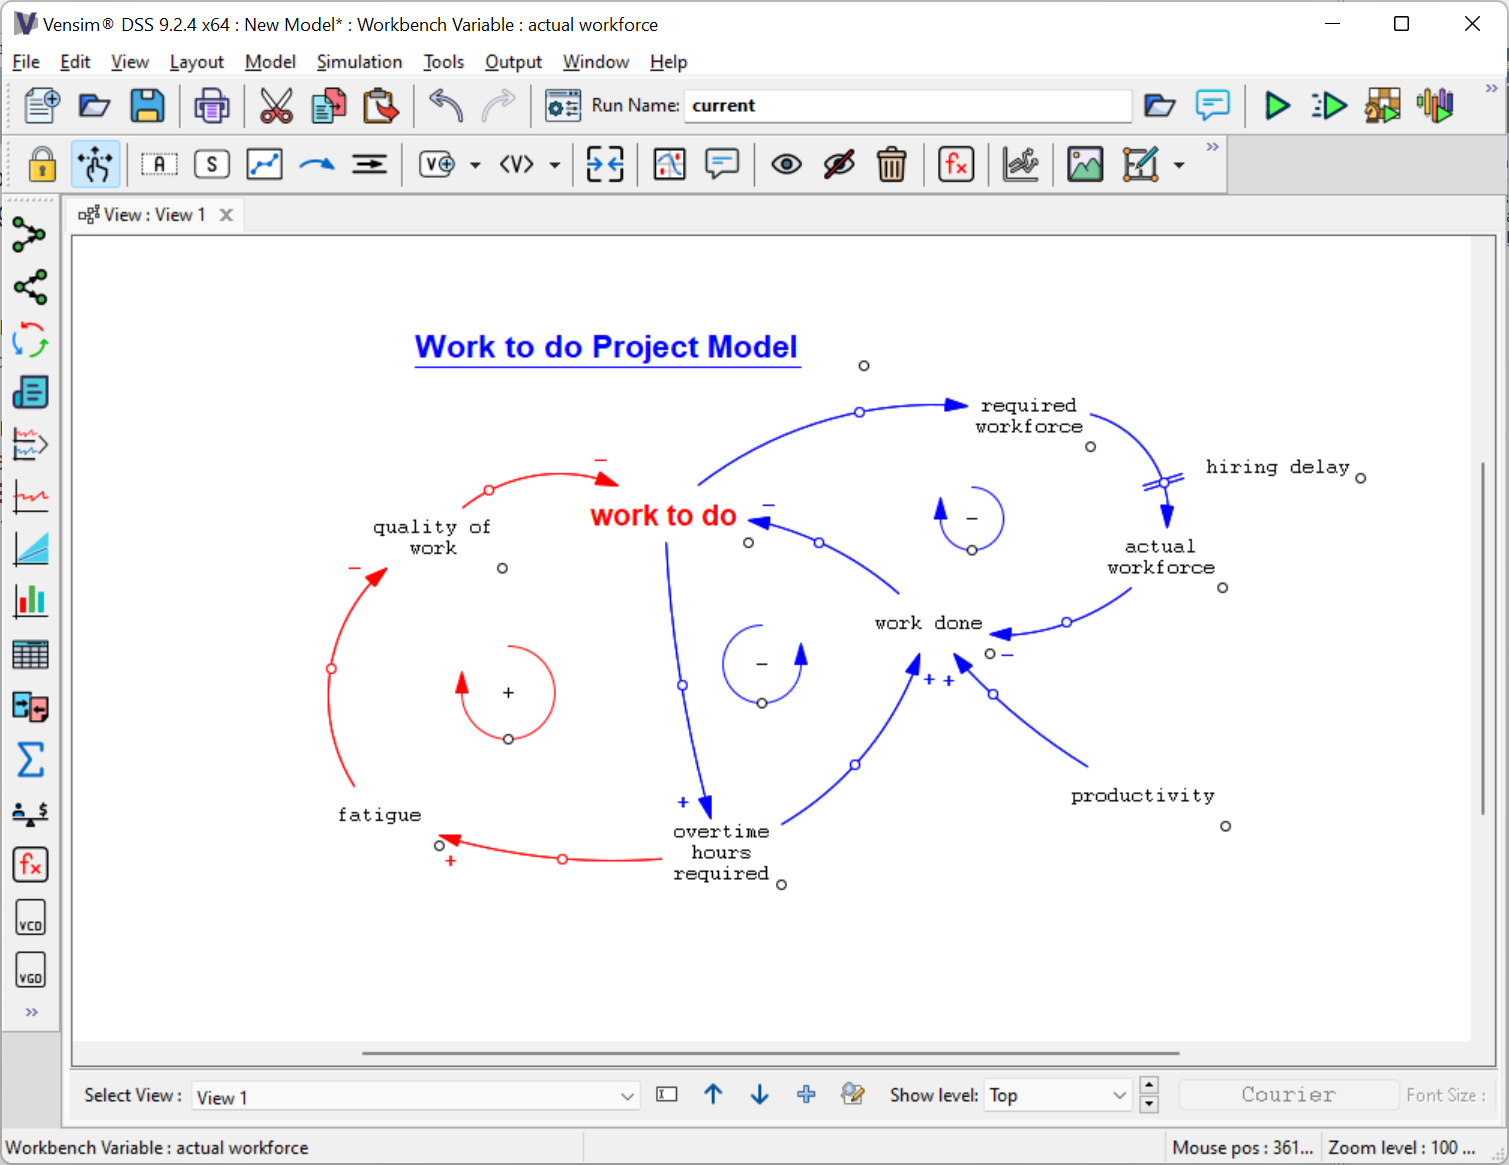
We see that overtime hours required increases the work done, which then decreases Work To Do (a negative feedback loop). However, overtime hours required also drives the positive feedback loop that increases Work To Do. To make this model more realistic, let us assume that we can change the size of the workforce through hiring and layoffs. Hiring workers will reduce the need for overtime and therefore reduce the fatigue/Work To Do spiral.
An Additional Feedback Loop
| Ø | Select the Move/Size tool and move the variable work done lower on the sketch. Reshape the arrows to and from work done, and move the negative loop symbol, as shown in the diagram below. |
| Ø | Select the Variable tool. Click on the sketch and type in the new variables required workforce, actual workforce and productivity (pressing Enter after each variable) as shown in the diagram below. |
| Ø | Select the Arrow tool and connect the variables as shown in the diagram below. |
| Ø | Add polarities to the arrows. For the arrow from required workforce to actual workforce click on the Checkbox Delay Marking. |
| Ø | Select the Comment tool and click to the right of the delay marking added above. Type in the phrase hiring delay, select blue as the Color and click on OK. You may need to move this somewhat to get the result shown below. |
| Ø | Select the Move/Size tool, click once on the negative feedback symbol to highlight it, then choose Edit>Copy (or Ctrl + C). Select Edit>Paste (or Ctrl + V), then click on OK or press the Enter key in the dialog to choose Replicate. The new loop image gets pasted on top of the first image. Drag the copied feedback loop from the old location and place it in the center of the new feedback loop. Click on it with the right mouse button (Macintosh: Ctrl + click) then under Shape choose Loop Clockwise then click OK. |
Your diagram will finally look something like this:

