| Ø | Click the New Model button, or select the menu item File>New Model… |
| Ø | In the Model Settings dialog (Time Bounds tab) type 30 for FINAL TIME, type (or select from the drop down box) 0.125 for TIME STEP. Click on the dropdown box for Units for Time, and select Year. Click on OK (or press Enter). |
| Ø | Select the Level tool and click somewhere in the middle of the sketch. Type the name Population, and press the Enter key. |
| Ø | Select the Rate tool. Click once (single click and release of the mouse button) about 2 inches (5 cm) to the left of the Level Population, then move the cursor on top of Population and click once again. Type the name births, and press Enter. |
| Ø | Click once on the Level Population then move the cursor about 2 inches (5 cm) right and click again. Type the name deaths, and press Enter. |
| Ø | Select the Variable tool. Click on the sketch below births, type birth rate and press Enter. Click on the sketch below deaths, type average lifetime and press Enter. |
| Ø | Select the Arrow tool, click once on birth rate then once on births. Click once on average lifetime, then once on deaths. |
| Ø | Click once on Population, then once on the sketch a little below and left of Population, then once on births. |
| Ø | Click once on Population, then once on the sketch a little below and right of Population, then once on deaths. |
| Ø | Click the Save button and save your model in the directory UserGuide\chap06. Name your model (we call it pop.mdl). |
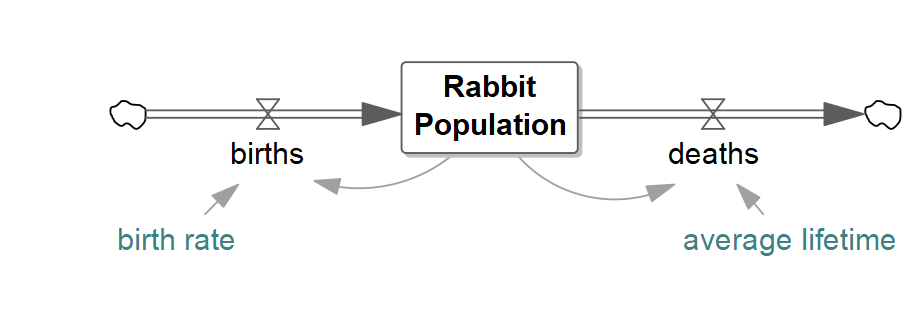
The structure of the Population model is now complete, as shown in the figure below. A positive feedback loop from Population to births increases Population, and a negative feedback loop from deaths decreases Population.

