The model is now structurally complete. However, if you were to try to simulate it you would get a message saying that the model has errors and can't be simulated. In order to simulate, it needs a set of equations that describe each relationship. These equations are simple algebraic expressions, defining one variable in terms of others that are causally connected. For example:
births = Population * birth rate
Looking at the sketch view, birth rate has no causes; it is a Constant in the model. This Constant has a numerical value which we will fill in later.
We will fill in units of measurement for each equation we enter. Units allow us to check for dimensional consistency among all the equations. Dimensional consistency is important as a formal check of correct model structure. We will use the menu item Model>Units Check (Ctrl + U) to check the whole model after we have added all the equations.
| Ø | Click on the Equations tool. |
All the variables in the model will turn black. The highlights are used as a visible checklist of completeness. The highlights indicate which variables still require equations or have incomplete equations. As you complete the equations for each of the variables, the highlights will disappear. The menu item Model>Check (Ctrl + T) or the Check Model button in the Equation Editor also checks and displays what remains to be done.
| Ø | Click on the variable births. |
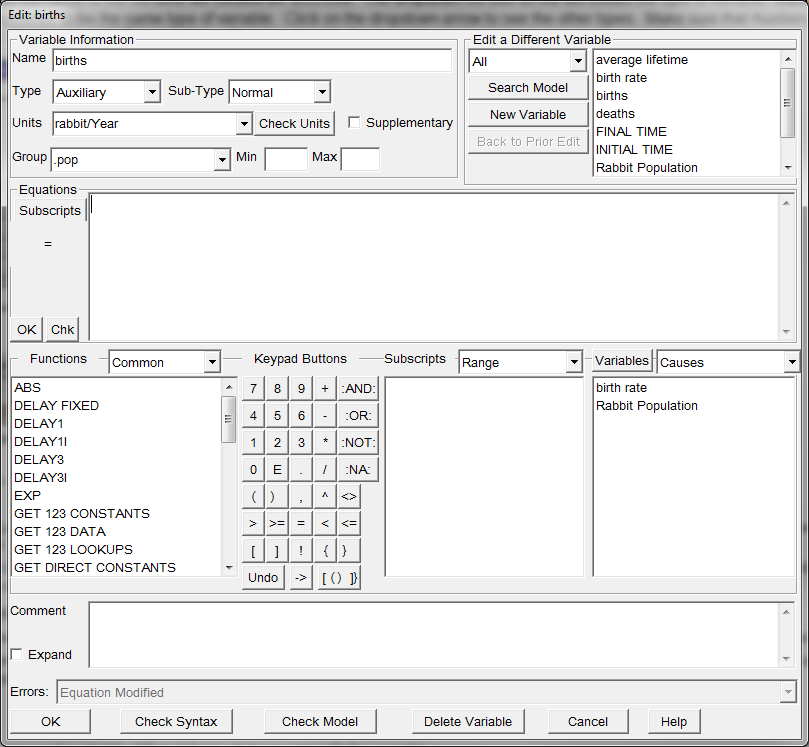
The Equation Editor will open. The exact appearance of the Equation Editor will depend on which Vensim configuration you are using. Vensim PLE and PLE Plus have a simplified Equation Editor, though the main elements are the same.
Variable Type: Auxiliary
The top of the editor has the name of the variable we clicked on: births. The dropdown list box on the left shows the type of variable: Auxiliary. Vensim considers rates and auxiliaries to be the same type of variable. Click on the dropdown arrow to see the other types. Make sure that Auxiliary is still selected when you leave the list.Put the cursor in the equation editing box (next to the = sign).

| Ø | Complete the equation for births as below (in the editing box) |
EITHER
| Ø | By typing Population * birth rate |
OR
| Ø | Click on the variable Population in the Variables list (in the middle of the Equation Editor), then type the * symbol (or click on it in the Equation Editor keypad), then click on birth rate in the Variables list. |
Spaces and new lines can be added to the equation for increased clarity, but are not necessary. To add a new line hold down the Ctrl key and press Enter. Note that you can't use a new line inside of a variable name.
Now we will add the units of measurement for births.
| Ø | Type in the units of measurement rabbit/Year in the Units: box. This indicates that we measure the rate of births in rabbit per Year. Click on OK or press Enter. |
If the model structure and equation agree and there are no syntax errors in the equation, the dialog box will disappear. If there are problems with the structure or equations, you will receive an error message indicating what is wrong.
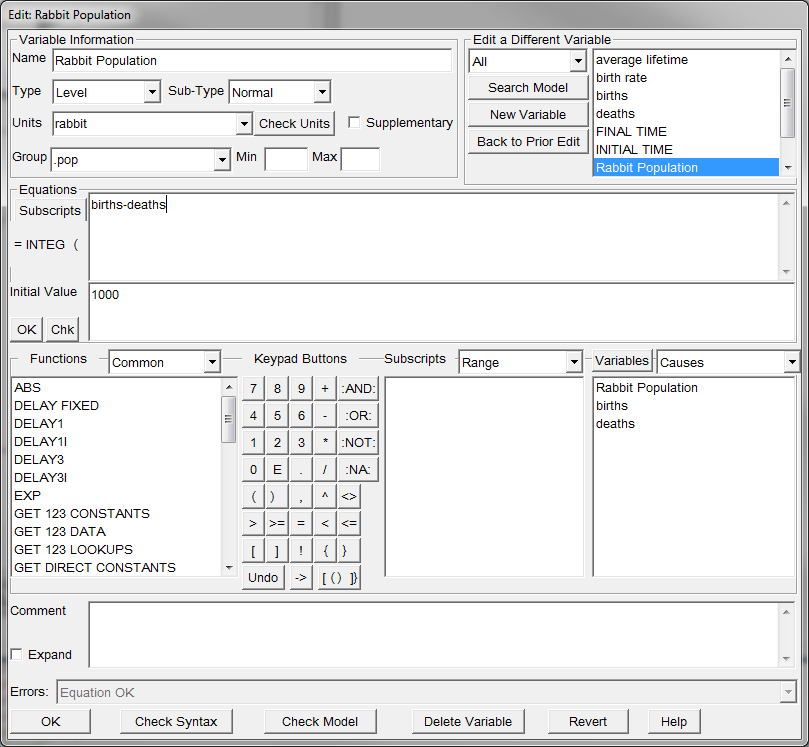
Variable Type: Level
| Ø | Click on Population. |
The Equation Editor opens and is slightly different from what we saw with the variable births.

The dropdown list box on the left shows the type of variable: Level. Left of the equation editing box is the INTEG function that defines a Level (integrating the variable over time). An equation is already present in the equation editing box. Because we connected rates with the names births and deaths to the Level, Vensim automatically enters the rates to the Level equation. Rates constructed by clicking first outside, and then on the Level are considered positive (inwards) flows; rates constructed by clicking on the Level, and then outside the Level are considered negative (draining) flows. If the rates are drawn in a different direction the sign can be changed in the Equation Editor. The equation for this Level is correct, births add to Population, deaths subtract from Population, so we need not change them.
The Equation Editor for a Level has an extra editing box to set the starting or initial value; the cursor is placed there.
| Ø | In the Initial Value editing box, type in 1000. |
This value is the initial number of rabbits at the start of the simulation (time zero).
| Ø | Type in the units of rabbit in the Units box. Click on OK or press Enter. |
| Ø | Click on birth rate. Type in the numbers 0.125 in the editing box. |
| Ø | Type in the units fraction/Year (if you prefer, enter instead 1/Year), this means that the fractional birth rate is measured in fraction (of rabbits) per year. Another way of saying this is (rabbits born / rabbit population) / Year (rabbit/rabbit)/Year = fraction/Year (rabbit cancels out). Click OK or press Enter. |
| Ø | Complete the remaining two equations as they are shown in the Equations listing below. |
All model variables should appear clear in the sketch after all the equations are entered. Units that have been previously entered can be selected again by clicking on the arrow in the Units box and selecting from the dropdown list.
pop.mdl Equations
average lifetime = 8
Units: Year
birth rate = 0.125
Units: fraction/Year
births = Population * birth rate
Units: rabbit/Year
deaths = Population / average lifetime
Units: rabbit/Year
Population = INTEG(
births - deaths,
1000)
Units: rabbit