As an example we will use a very simple model fragment with some structure around price and demand. The example below is not very complete. The pricing decision is made to achieve a certain revenue goal with the expectation that demand will not be changed by price, while demand does in fact depend on price. This model embodies a single dynamic hypothesis, and is interesting to experiment in isolation even though its behavior, as you will see, is quite unrealistic.
| Ø | Create the diagram pictured below or open the model UserGuide\chap07\complete\price1.mdl. |
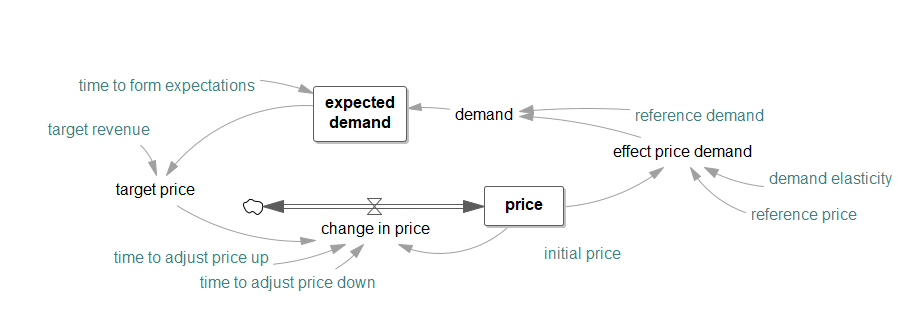
Use the steps outlined in the previous chapter to create this model. There are two elements that are different in this diagram from what was done there. The first is the two-way flow for change in price. The second is the absence of flows into the Level expected demand. To draw the two way flow:
| Ø | Use the Rate tool to draw a flow from the left of price into price and label the rage change in price. |
| Ø | Click on the Move/Size tool. |
| Ø | With the Right Click or Control Click on the small handle appearing in the middle of the pipe from the cloud to change in price. |
| Ø | In the dialog that appears check the box Arrowhead. |
![]()
The creation of the arrows into the level expected demand is done in the same way that all other arrows are created. Some more comments on the way this Level is depicted will be made when the equation for it is created.