Custom Graphs are used to customize the content of a graph so as to show selected variables, runs, and style, in one graph. Custom Graphs are created from the Graph Control in the Control Panel.
If cust3.mdl is not already open:
| Ø | Open the model cust3.mdl in the directory UserGuide\chap08\complete. |
To make a Custom Graph:
| Ø | Click on the Control Panel button on the Toolbar. Click on the tab Graphs in the Control Panel. |
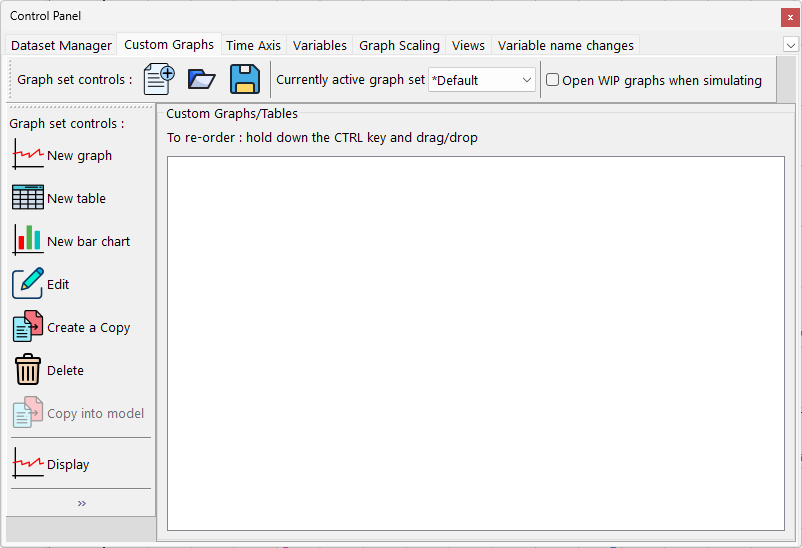
| Ø | Click the button New…. The Custom Graph Editor opens with the cursor positioned at the graph Title editing box. |
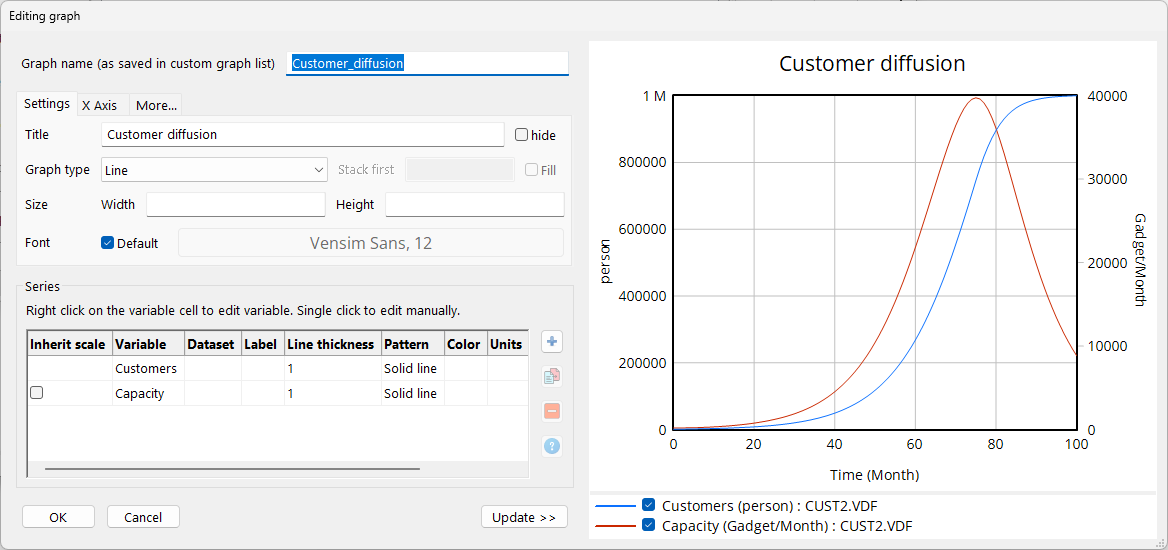
| Ø | Type in a name for the graph (e.g., Customer Diffusion) |
| Ø | Using the mouse, move to the Variable boxes on the left side of the graph editor and click on the top button labeled Sel. A Variable Selection dialog box appears. Move the scrollbar down the list and double click on Customers (or type the first letters in Customers until it is highlighted, then press Enter). |
| Ø | Click on the second button down labeled Sel. Double click on the variable Customers. |
| Ø | Click on the third button down labeled Sel. Double click on the variable Capacity. |
| Ø | Click on the fourth button down labeled Sel. Double click on the variable Capacity. |
| Ø | Click the Scale checkbox that lies left and between the first two variables. |
| Ø | Click the Scale checkbox that lies left and between the third and fourth variable. |
| Ø | Click on the Dataset editing box just right of the first variable. Type in the run name cust2. |
| Ø | Click on the Dataset editing box just right of the second variable. Type in the run name cust4. |
| Ø | Click on the Dataset editing box just right of the third variable. Type in the run name cust2. |
| Ø | Click on the Dataset editing box just right of the fourth variable. Type in the run name cust4. |
| Ø | Click on the LineW (Line Width) editing box just right of the first variable, type 2. |
| Ø | Click on the LineW (Line Width) editing box just right of the second variable, type 2. |
The Custom Graph Editor should look like this:
| Ø | Click on OK. The Custom Graph Editor closes and the Graph Control is left open. |
| Ø | Click on the name of your graph in the Graph Control, then click on the button Display. |
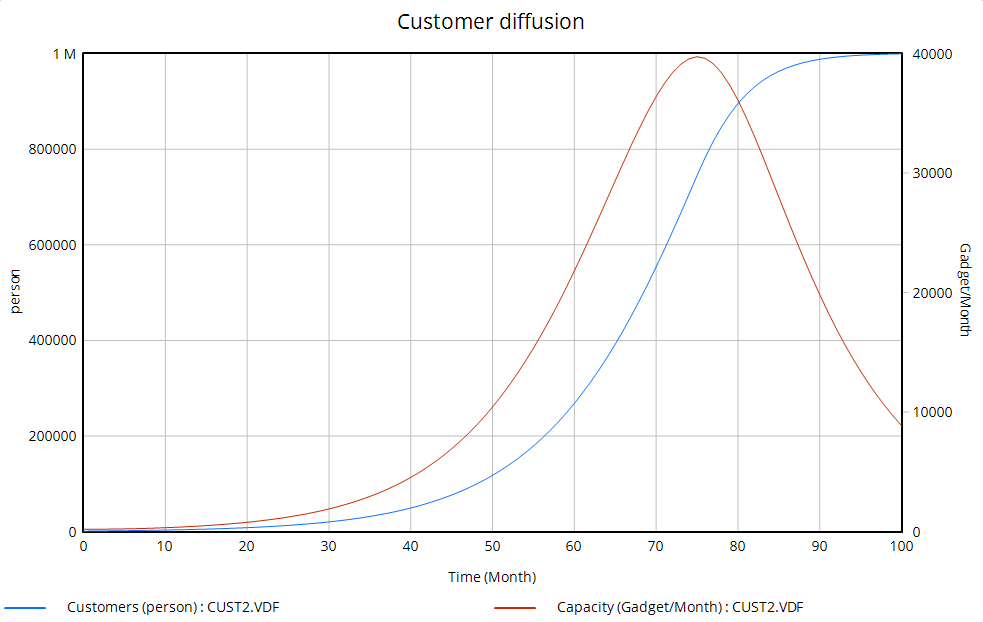
The graph is displayed. You can easily see how the behavior of one variable relates to another. Experiment with different options in the Custom Graph Editor by clicking on the button Modify in the Graph Control, and changing things. If you do not include a dataset next to a variable name in the graph dialog, the Display button will show the first loaded run (the run at the top of the Loaded list in the Datasets Control).