We will continue working in the same view.
Slider for Advertising
| Ø | Select the Input Output tool 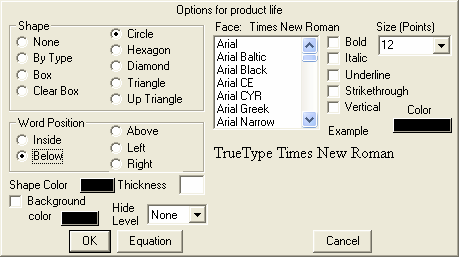 and click on the upper left portion of the sketch. The Input Output Object Settings dialog will open. and click on the upper left portion of the sketch. The Input Output Object Settings dialog will open. |
| Ø | Select type Input Slider (probably already selected by default). |
| Ø | Click on the Constant... button and select c advertising spending from the dialog. |
| Ø | Enter the numbers 0, 200 E6, and 0.5E6 in the Ranging from, to, and with increment fields. |
| Ø | Click on Label with varname to uncheck it. |
Your dialog should look like:
| Ø | Click on OK. |
A Slider will be drawn on the screen.
| Ø | Adjust its size so that it more or less takes up the space to the graph. |
| Ø | Select the Comment tool. Click above the Slider. |
| Ø | Type in the comment "Advertising Spending ($/Year)," select Shape None and click on OK. This is a label for the Slider you just created. |
Slider for Product Life
Now repeat this entire process creating a Slider for obsolescence time with a range from 0.5 to 10 and increment of 0.1. Place the label "Product Lifetime (years)" above this slider.
Other Changeable Constants
| Ø | Select the Shadow Variable tool  and add in the model Constants customer sales effectiveness and Market Size. and add in the model Constants customer sales effectiveness and Market Size. |
| Ø | Highlight the new Shadow Variables and set the color on them to black from the Status Bar color button or Right-Click on them in turn and set their text color to black. |
Lining Things Up
| Ø | To make the things you have added line up nicely select the Size/Move tool  then drag over all the elements on the left hand side to highlight them. then drag over all the elements on the left hand side to highlight them. |
| Ø | Shift-Click on the topmost comment (Advertising Spending ($/year)) once to unhighlight it, and again to highlight it. |
| Ø | From the Layout Menu select the item Center on LastSel. |
| Ø | Position the whole selection by dragging the middle of the selection box until it looks good. |
You should end up with.

Now is a good time to save your work under a new name. The changes that have been made to wom1.mdl are also saved in the model wom2.mdl contained in the directory UserGuide\chap11\Complete if you want to compare them with your own changes.
Simulating the Model
| Ø | Click on the Set Up a Simulation button in the Toolbar  (or type Ctrl+E). Type in a new run name. (or type Ctrl+E). Type in a new run name. |
The Graph will fill in, the Sliders will activate, and the two shadow variables will highlight.
| Ø | Drag a slider and then click on the Simulate button in the Toolbar  or type (Ctrl+R). or type (Ctrl+R). |
The model will simulate and the results for the new run will be displayed in the graph. Repeat this making other changes. You can change the run name or keep it the same. Each time you simulate the results will be displayed in the graph on the right.
You can also click on the SyntheSim button  and see the graph update automatically as you move the sliders. In this case sliders will also appear for customer sales effectiveness and Market Size.