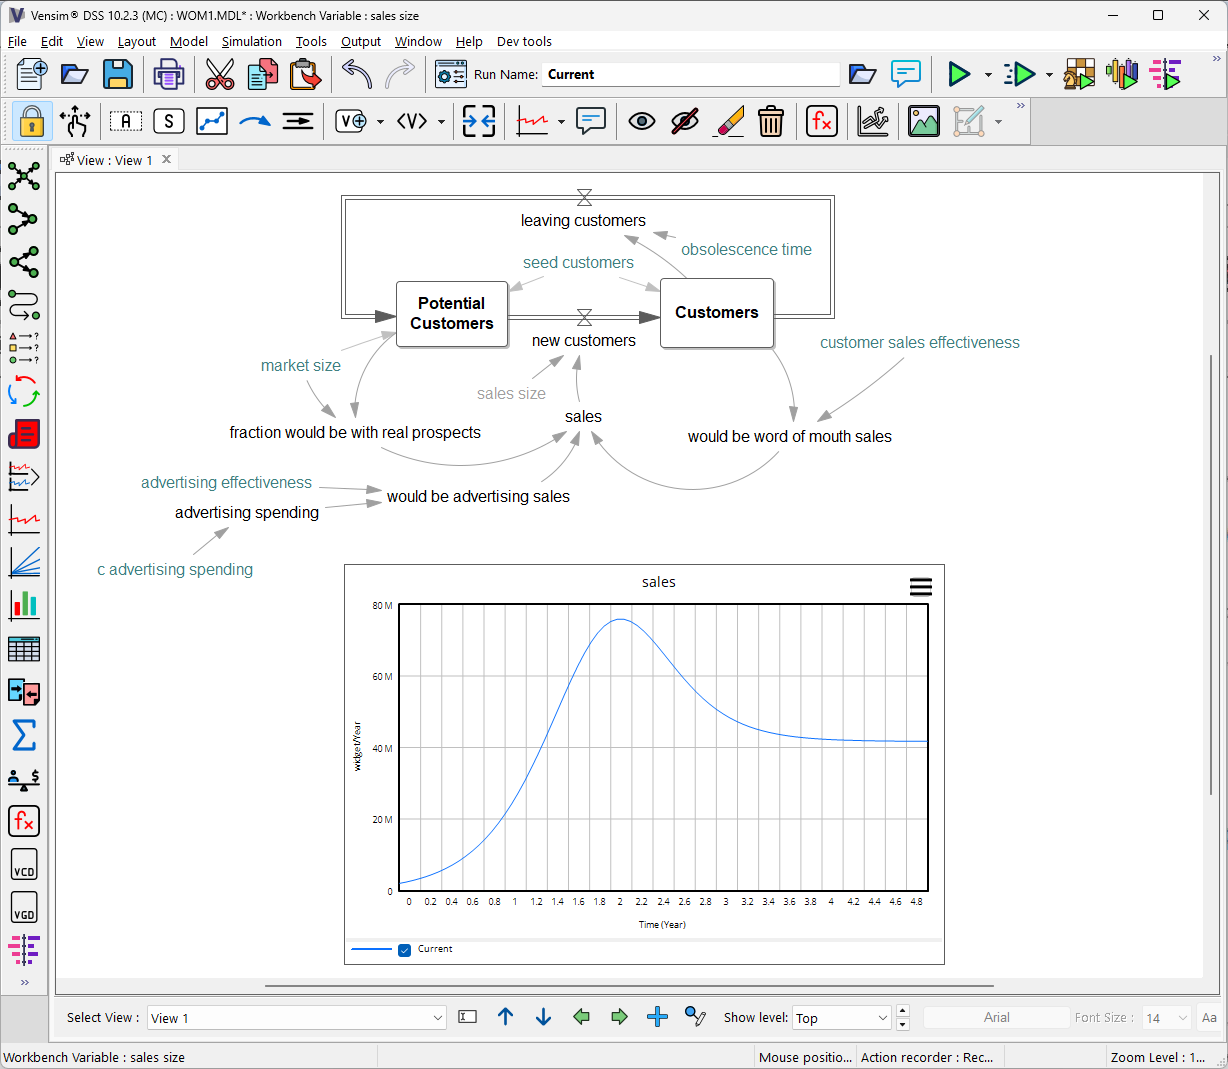
Begin by creating a new view to which we can add Output Controls.
| Ø | Click on the Status Bar View button (this is at the bottom of the screen and labeled View 1 for this model) and select **New**. |
A new and empty View will open.
| Ø | Select the Control dropdown button |
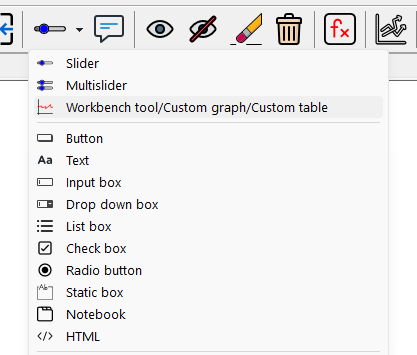
| Ø | Select Workbench tool/custom graph/custom table |
| Ø | Move the mouse to the right hand side of the sketch and click. This will open the Input Output Object Settings dialog. |
| Ø | Select type Output Workbench Tool then click on the Auxiliary button and Select sales from the list (clicking OK to close the Variable Selection dialog). |
| Ø | Click on the dropdown and select the tool Graph from the dropdown list. |
You dialog should look like:
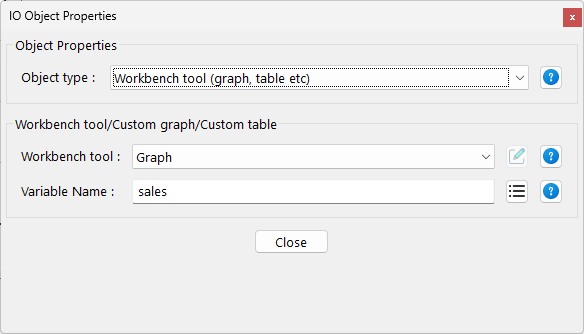
| Ø | Click on OK. |
| Ø | Click on the Simulate button  on the Toolbar (or type Ctrl+R). on the Toolbar (or type Ctrl+R). |
The model will simulate and the graph will fill in.