In addition to working with thumbnail sketches SyntheSim will work with graphs and tables imbedded as Input Output Objects.
| Ø | Click on the Stop Simulation button. |
| Ø | Click on the Control Panel button and click on the Graphs tab. |
| Ø | Click on the New button. |
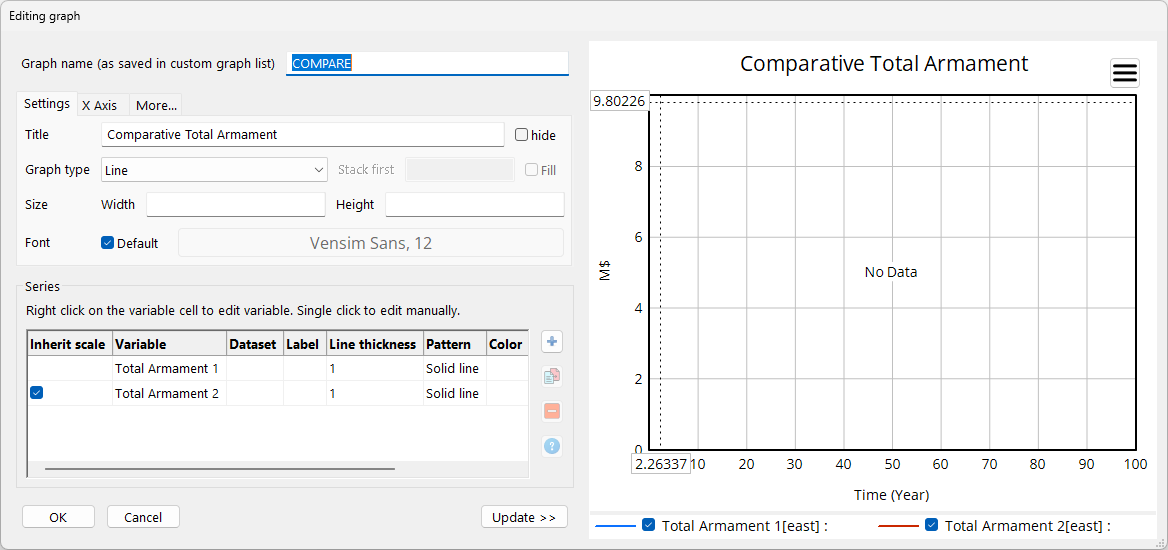
| Ø | In the Custom Graph editor add the title "Comparative Total Armament" and add the variables Total Armament 1 and Total Armament 2. For Graph Name enter COMPARE. |
| Ø | Check the Scale checkbox to the left of the variable names. Add 0 under Y-Min and 800 under Y-Max at the right in the top row. |
| Ø | Check the Soft Bounds checkbox at the bottom. The dialog should appear as: |
| Ø | Select the Menu Item View>New. |
| Ø | Click on the Input Output tool. |
| Ø | In the dialog click on the Output Custom Graph radio button. Select COMPARE from the dropdown list at the bottom and click on OK. |
| Ø | Size the graph to be quite large. |
| Ø | Click below the graph at the left. |
| Ø | In the Input/Output Object dialog click on the Constant... button and select desired strength ratio 1. |
| Ø | Set the range from 0 to 2 with increment .01 and click on OK. |
| Ø | Click below the graph at the right. |
| Ø | In the Input/Output Object dialog click on the Constant... button and select desired strength ratio 2. |
| Ø | Set the range from 0 to 2 with increment .01 and click on OK. |
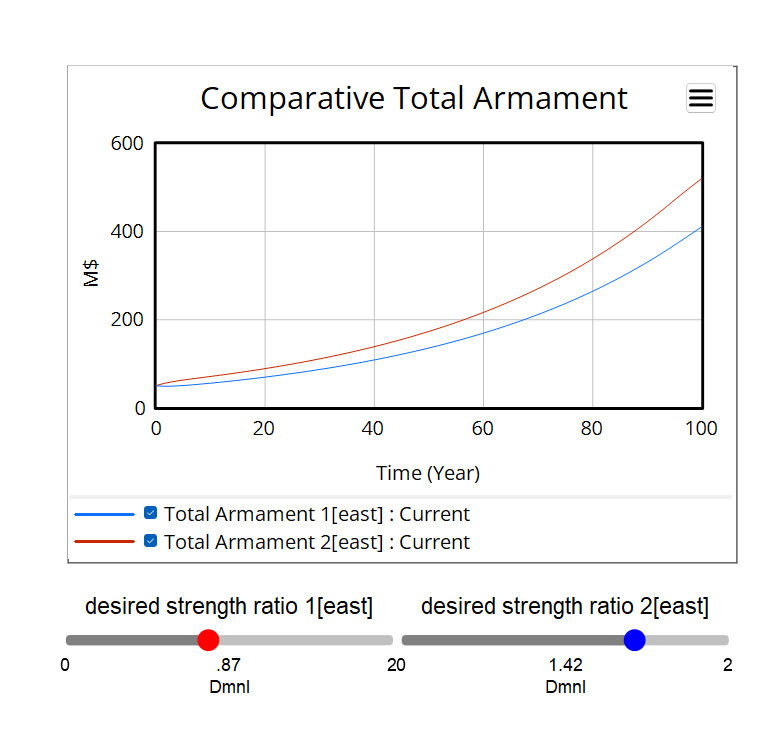
You can make the sliders slightly bigger and position them to look good. Go to the control panel and clear any runs, then start SyntheSim mode and move the sliders. You should see something like:
You can go back to the previous view and continue to make changes to model constants. When you return to this view you will see the results of those changes shown in the graph.