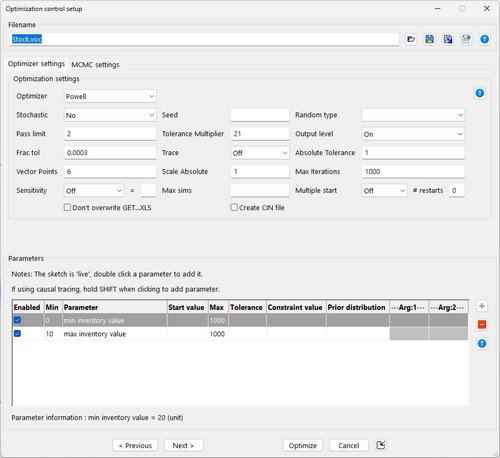
| Ø | Click on the Select Constant... button and choose min inventory value from the list. Type 0 in the minimum box (left hand box, <=), type 1000 in the maximum box (right hand box, <=), then click on the button Add Editing. |
| Ø | Click on the Select Constant... button and choose max inventory value from the list. Type 10 in the minimum box (left hand box, <=), type 1000 in the maximum box (right hand box, <=), then click on the button Add Editing. |
Your Optimization Control should appear as below:

| Ø | Click on Finish. |
The optimizer runs, generates an output file, and loads the optimized run.

| Ø | Click the Control Panel button then click the Datasets tab. Unload all runs except base and optimize. |
| Ø | Select the variable Cumulative Profit into the workbench and click on the Graph tool and on the Table tool. |
Compare the final value of Cumulative Profit in the optimize run to value in the base run.


The graph shows the behavior of the optimum run, the table shows the values for the maximum Cumulative Profit found by the optimizer.