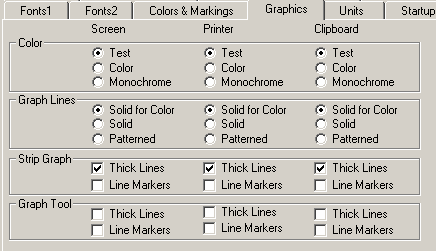
The Graphics tab is used to control the appearance of graphical output going to the screen, printer and clipboard. By default Vensim tests the screen and printer to determine how to manage output. While this is normally fine for the screen, for both the printer and the clipboard you may wish to override these defaults and specify more completely the desired output characteristics.
The options under Screen control the appearance of graphs on your computer. The options under Printer control the appearance of graphs when you print them. The options under Clipboard control the appearance of graphics when you export them or save them to disk. In each case you have the same set of possible options and all can be set independently.
Note that the Export graphics and sketch information formatted for printer option in the Settings tab will determine whether the printer or screen is used in testing the device capabilities of the clipboard.

Color (Test or Color or Monochrome) determines whether or not to use different colors for different plot lines.
| • | Test tests the device to see if it is capable of displaying color. For some notebook computers and printers this test can result in misleading or incomplete results. For this reason you may want to override the test and force Vensim to use color or monochrome even when this is inconsistent with test results. |
| • | Color causes graphs to be drawn with colored lines. On monochrome devices this may result in gray scale attributes. |
| • | Monochrome causes all graphs to be drawn with black lines. |
Graph Lines (Solid for Color or Solid or Patterned) determines the line styles used with graph lines.
| • | Solid for Color uses solid lines when the lines can be displayed in color (possibly because you have selected Always Color above). If the lines are monochrome they will be patterned (solid, dotted, dashed, dash-dotted and dash-dot-dotted). |
| • | Solid causes graph lines to be displayed as solid lines under all conditions. |
| • | Patterned forces lines to be displayed with patterns under all conditions. If you click on this you will notice that the Thick Line options described below are both grayed. This is because you cannot display a thick line with a line pattern. |
Strip Graph lets you set line attributes for the Strip graph.
| • | Thick Lines, if checked, causes the Strip Graph to display different runs with different line thicknesses. The first run is displayed thin, the second thicker and so on. You may find this helpful in distinguishing between runs. This option is only active if the lines are being displayed as solid lines. |
| • | Line Markers, if checked, causes lines to be displayed with numbers or other markers on top of them. You can choose the marks in the Graphics tab. Graphs drawn in this manner are somewhat more cluttered than normal graphs but it can be easier to distinguish graph lines. |
Graph Tool allows you to set line attributes for the Graph Tool. The options are precisely the same as those for the Strip Graph.