![]() The Causal Table tool presents the user with a 2 dimensional matrix showing variables and what other variables they influence. If variables are connected via a formatted arrow (colour/thickness/pattern), this is placed in the table as well to show the kind of relationship between the two variables.
The Causal Table tool presents the user with a 2 dimensional matrix showing variables and what other variables they influence. If variables are connected via a formatted arrow (colour/thickness/pattern), this is placed in the table as well to show the kind of relationship between the two variables.
The following image shows the sample output from the causal table tool.
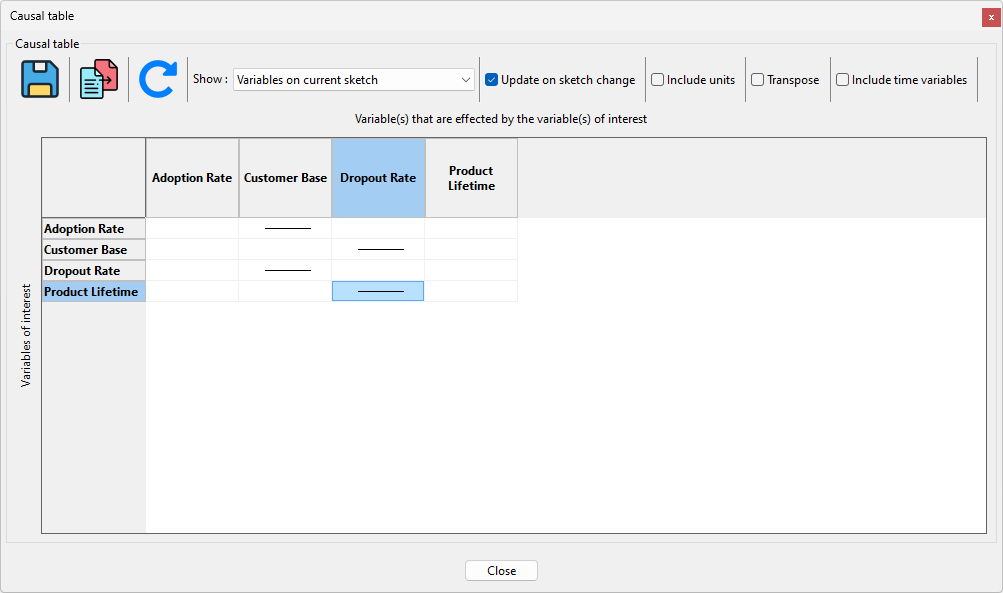
Toolbar functions
|
Saves the table as a CSV file. |
|
Copy the table contents to the clipboard. |
|
Refresh the table |
|
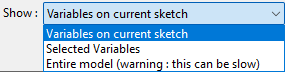
Select what to show in the table. |
|
Update the table automatically when the sketch is changed. |
|
Include units in the table output. |
|
Transpose the table. |
|
Switch to include time variables in the output. |


Tool options (not in PLE/PLE+)
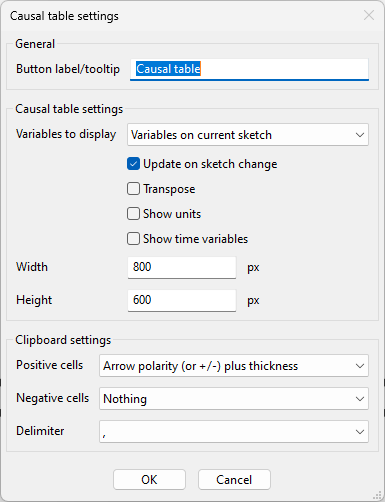
The following image shows the various options available to customize the causal table tool.