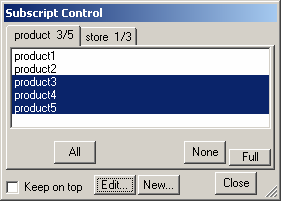
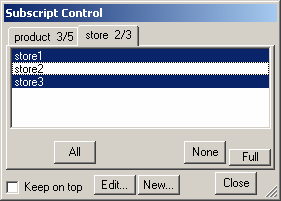
A subscripted variable appearing on a sketch represents more than one set of values. Vensim uses the Subscript Control to determine which set of values to plot by choosing the first selected subscript combination. For example, suppose that sales is subscripted by product and store with the following subscript selections active:


Then a graph would be shown for sales[product3,store1].
You cannot tell from the sketch which subscripts are displayed, but if you bring up the ToolTip graph this will be labeled.

Thus is you wanted to see store2, you would need to select it in the Subscript Control for store. As you make changes in the Subscript Control the graphs will be redrawn, so it is relatively easy to pass through the different subscripts in the model.