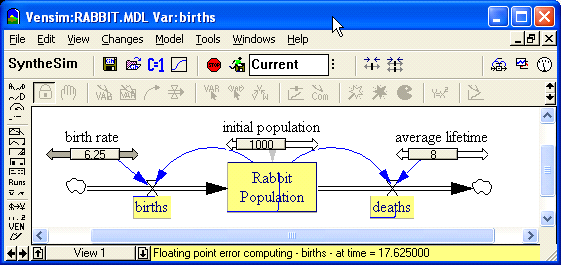
If you want to see a larger version of a SyntheSim graph just hover over the graph with the mouse for a few seconds. That is, position the mouse over the graph and let it stay there without moving. When you do this a ToolTip graph will appear:

ToolTip graphs are the same as the smaller graphs except that the axis values are labeled and the variable name appears across the top. The graphs are kept identical so it is easy to relate them to what you see on the sketch view.
If you want to get a larger graph of a variable just click on it and then click on the Graph tool. This will display a regular graph. Though the scales will be different it will have the same content as the graphs displayed on the diagram. Similarly, you can use the Table tool to see the actual numbers.