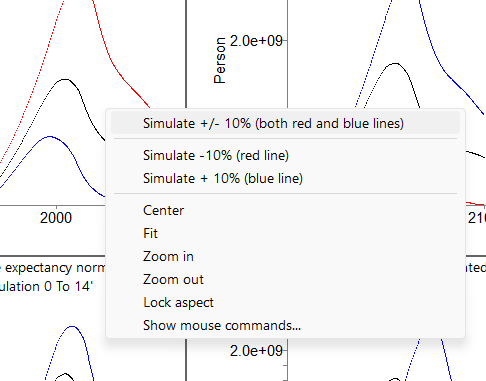
You can right click your mouse on most areas of the Sensitivity2All output windows.
When you right click on a constant in the tornado graph, the following menu will be displayed. Selecting any of the options will run the simulation again with the constants you have selected adjusted by +/- 10%.

Right clicking on one of the postage stamp graphs will also allow you to simulate.
