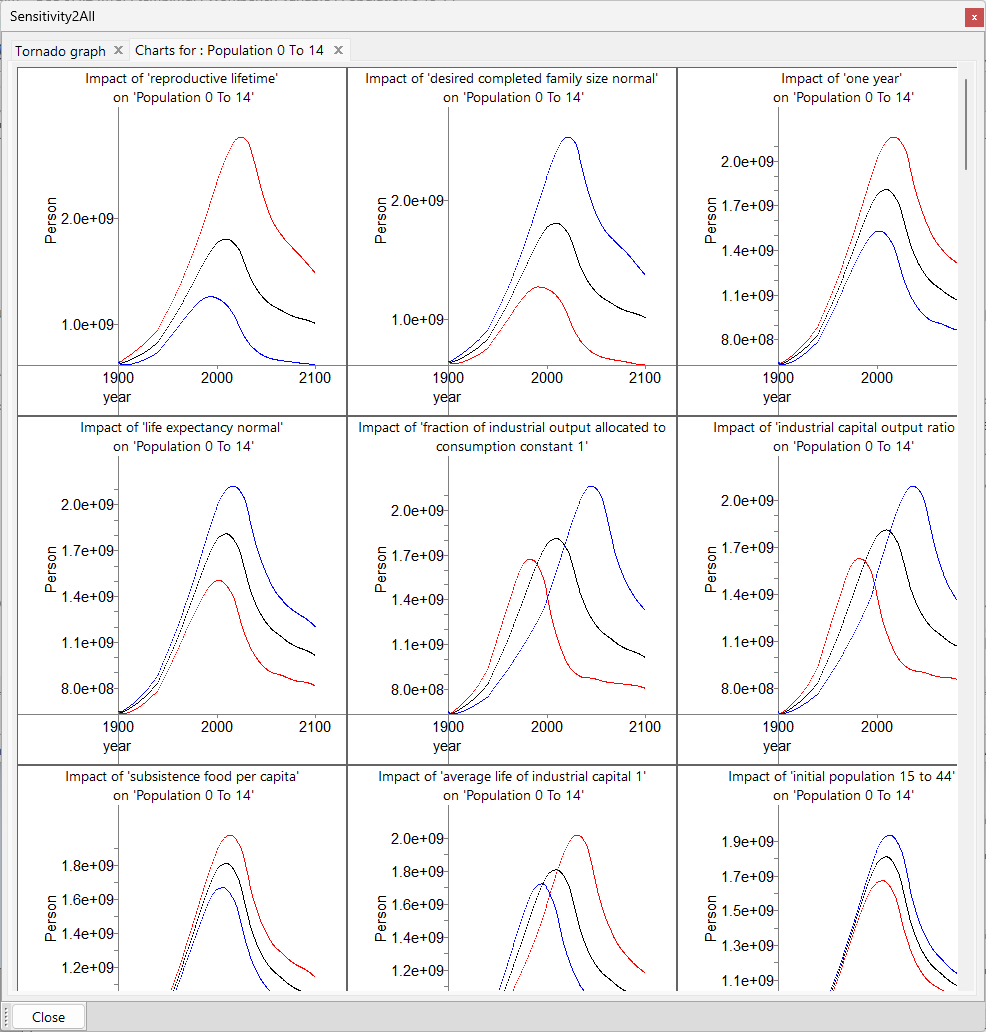
Sensitivity2All will also let you compare all the constants and their effects on your variables quickly using postage stamp graphs. Postage stamp graphs are simply mini graphs where many can fit on a screen at one time.
To view the postage stamp graphs, simply right click on one of the constants in the tornado graph to display the following menu.
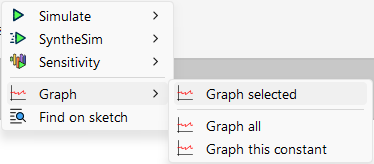
Now you can view the graphs for the selected constants, all the graphs (this can be slow for large models) or just the graph for the constant you right clicked over.
The window below shows the postage stamp graphs. Each plot contains three series, the base run (black), the run where the constant was reduced by 10% (red) and the run where the constant was increased by 10%.
You can also right click on any graph and quickly simulate the +/- runs.