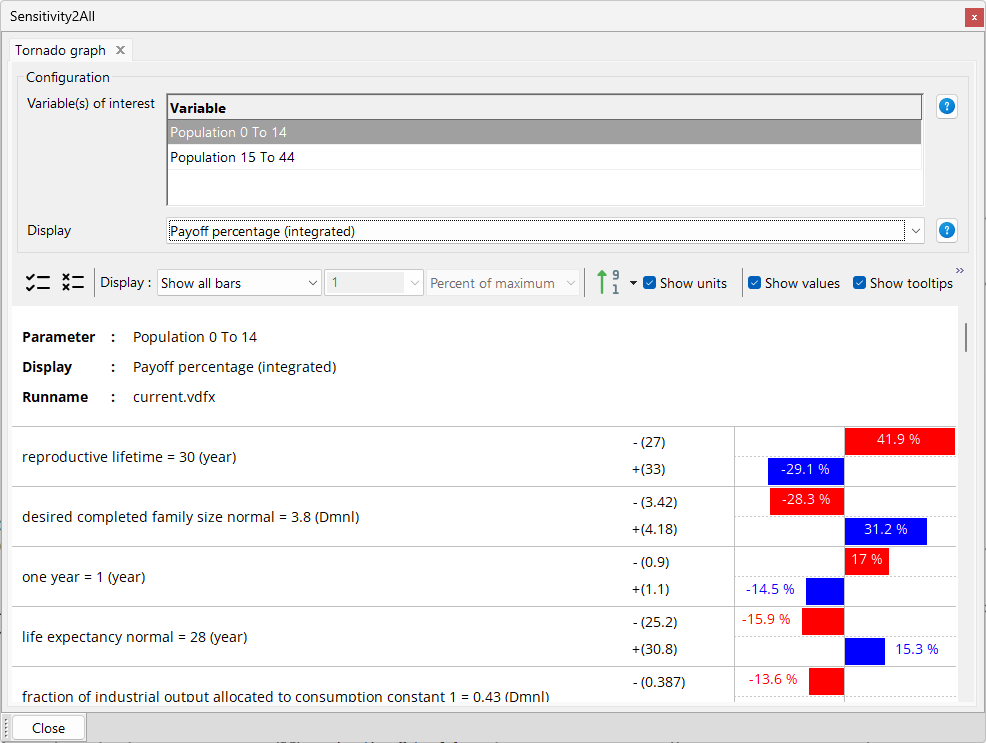
When the model has been run, you will see a tornado graph with some configuration controls.
Variables of interest |
Use this to select any of the variables you ran the tool with |
Display |
This allows you to select various methods of displaying the tornado graph - Mean absolute deviation between base run and +/-10% runs - Sum of squares error between base run and +/-10% runs - Variance between base run and +/-10% runs - Payoff percentage (integrated) - Payoff percentage (calculated at FINAL TIME)
|
Toolbar |
This allows you to configure what is shown in the tornado graph - Select all/none - Show all bars/hide zeros/hide bars less than - Sort - Show values/tooltips - Save the tornado - Copy to clipboard |
